

SPSS questionnaire data analysis begins with a deceptively simple question: what does each response represent? A usable spreadsheet does not necessarily contain a usable research measure. You need to connect eligibility, question routing, recorded answers, score construction and statistical comparisons without losing track of who contributes to each result.
This guide follows that chain from the original survey export to a defensible research answer. It is designed primarily for students preparing dissertations and theses in the USA, with guidance also relevant to UK research projects. Your approved protocol, instrument instructions and institutional requirements take precedence over these examples.
The emphasis is operational. You will learn how to account for respondents, choose percentage denominators, handle select-all questions, organize repeated observations and document scoring rules. All numerical examples are invented for teaching. They do not describe real students, customers or research findings.
Define the answer before organizing the responses
Write down what you want to learn before choosing a procedure. “Analyze my questionnaire” could mean describing resource use, comparing a score between departments or estimating change after a workshop. Each task requires different variables and different assumptions about the observations.
For every research question, identify the population, outcome, explanatory variables and time frame. Then specify the quantity you want to report. This might be the proportion using tutoring, the mean of a documented scale or the difference between two measurements. A named quantity makes the analysis easier to audit.
Keep descriptive questions separate from explanatory claims. A survey can describe what respondents reported without establishing why they reported it. A cross-sectional association between support and confidence does not demonstrate that support caused confidence. Your design places boundaries around the conclusions, regardless of software.
Create a respondent accounting ledger
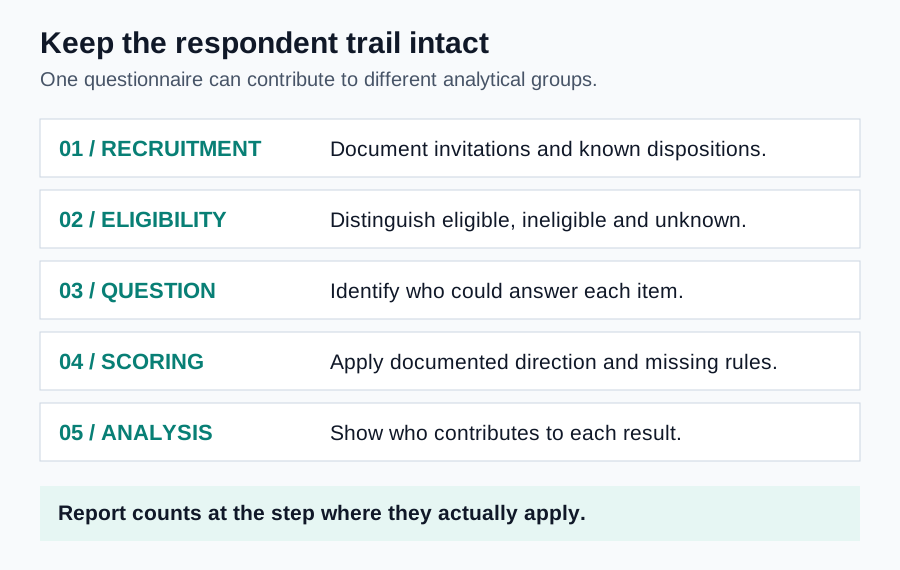
The questionnaire export usually contains answers, not a complete account of recruitment. Maintain a separate ledger showing invitations, eligibility decisions, starts, partial submissions and usable questionnaires. Without that information, a response percentage may refer to several different groups without making the distinction clear.
A unique research identifier should connect the ledger and response file where your protocol permits. Do not use names or email addresses as routine analytical identifiers. Keep any approved linking key separately and restrict access. The analysis file should contain only the information necessary for its purpose.
Eligibility can be known, unknown or demonstrably absent. Someone who never opened an invitation is not automatically ineligible. Similarly, someone who started the survey but failed an eligibility question should not remain in the analytical sample merely because their later answers look complete.
AAPOR’s Standard Definitions distinguish sample dispositions and survey outcome rates. Use the definition appropriate to your recruitment design rather than calling every completion percentage a response rate.
If you posted an open survey link, the number of people who saw it may be unknown. Report the recruitment method and known counts honestly. Do not divide completed questionnaires by social-media followers and describe the resulting number as a formal response rate without a justified sampling definition.
Preserve routing and questionnaire versions
Question routing creates meaningful absences. A respondent who never used a service may correctly skip questions about that service. Their blank satisfaction response is different from a service user who saw the question but declined to answer. Treating both as an identical missing response obscures your study design.
Store a variable showing whether a question was applicable or displayed whenever reliable information is available. Keep the original routing rule in the codebook. Later, you can distinguish the full respondent sample from the smaller group eligible to answer a particular block.
Also record questionnaire versions. Changing response options midway through collection can affect comparability even when the question retains its variable name. A new “not applicable” option may alter the distribution of substantive responses. Document the change and evaluate whether combining versions remains reasonable.
The CDC BRFSS questionnaire archive illustrates why survey documentation should be tied to a specific questionnaire year. Retain the version actually administered, not a replacement downloaded after collection.
Make the codebook an analysis specification
A useful codebook does more than translate numbers into labels. It records the exact question, variable name, permitted answers, eligibility branch, missing-response codes and planned role in the analysis. Include units and time windows for questions about quantities, such as weekly study hours.
For a categorical variable, distinguish stored values from meaning. Codes 1, 2 and 3 for departments do not imply distances or ordering. For an ordered item, record the direction explicitly. A higher score might represent greater satisfaction on one item and greater difficulty on another.
Document derived variables separately. Record the contributing items, reversals, minimum completion requirement and possible range. Add a rule version so that an updated instrument instruction does not silently change scores already reported. Someone reading the file months later should be able to reconstruct the calculation.
If basic value labels, impossible codes or export problems remain unresolved, first consult the SPSS data cleaning services guide. Score construction should not conceal uncertainty about what the original answers mean.
Choose denominators before making percentages
A percentage needs a numerator and an eligible denominator. Suppose you report the proportion satisfied with a tutoring service. Possible denominators include all survey respondents, all service users and all service users answering the satisfaction item. Those quantities answer different questions.
Name the denominator in the table note or adjacent sentence. “Among 80 respondents who used tutoring and answered the item, 52 reported satisfaction” is interpretable. “Sixty-five percent were satisfied” leaves readers unable to identify whose experience the result describes.
Item-specific denominators are often appropriate for descriptive tables, but they need visibility. If the denominator changes from 110 to 86 across questions, do not present the percentages as though everyone answered every item. Include the valid count and a short missingness explanation.
For comparisons, consider whether different denominators select different kinds of respondents. A satisfaction comparison based only on service users excludes nonusers by design. It cannot establish how satisfied the entire student population would be if everyone used the service.
Handle select-all questions as multiple responses
A select-all question does not behave like a single-choice question. One person can select several resources, so the total number of selections may exceed the number of respondents. Usually, each option is represented by its own indicator, with an explicit rule for selected, not selected and unknown.
Do not automatically code every blank as zero. An unchecked box may mean “not selected” when the respondent actually completed that block. A blank generated because the block was never displayed is different. Export behavior and routing information should guide that distinction.
IBM documents multiple-response sets for groups of dichotomous or categorical variables. Define the counted value and verify the set against a few original records before interpreting its tables.
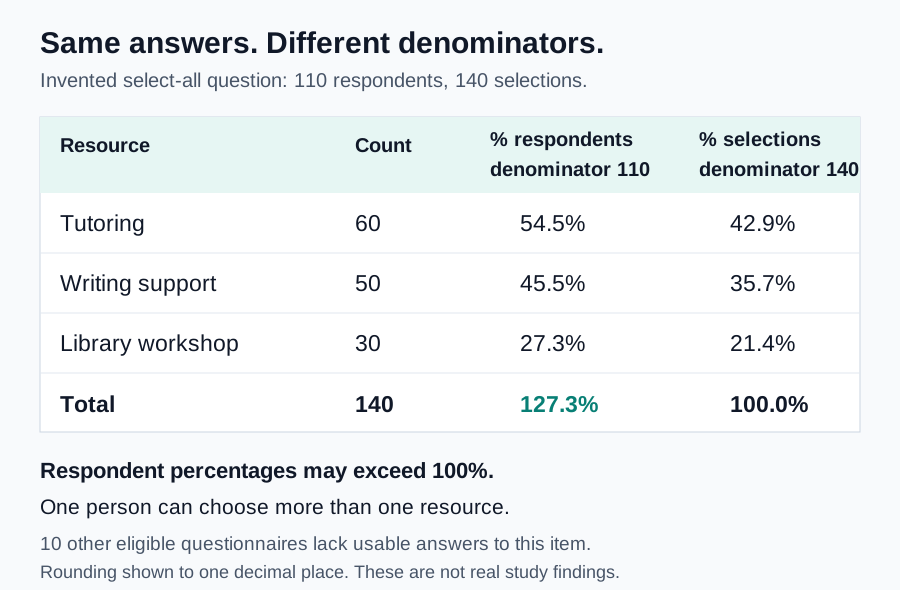
Percent of respondents and percent of selections are both legitimate descriptive quantities when clearly labeled. Respondent percentages can sum above 100% because selections overlap. Selection percentages describe how the total selection count is distributed; they do not describe the proportion of people choosing an option.
Invented example: the same answers produce different percentages
Consider a teaching survey with 120 eligible submitted questionnaires. Of these, 110 respondents answered a select-all resource question. Sixty selected tutoring, 50 selected writing support and 30 selected the library workshop. Because people could choose multiple options, these counts total 140 selections.
Using the 110 respondents answering the question, tutoring was selected by 60 ÷ 110 × 100 = 54.5%. Writing support accounted for 45.5% of respondents, and the library workshop accounted for 27.3%. The percentages sum to approximately 127.3%, which is expected for overlapping choices.
Using all 140 selections instead, tutoring accounted for 42.9% of selections, writing support for 35.7% and the workshop for 21.4%. These percentages sum to approximately 100%. Neither table is interchangeable with a percentage based on all 120 eligible questionnaires.
The ten respondents without usable answers are not silently counted as resource nonusers. A report should explain why their answers were unavailable. This example illustrates denominator choice only; it provides no evidence about a real university or differences between student populations.
Decide whether the dataset should be wide or long
In a wide dataset, one respondent occupies one row and repeated measurements occupy separate columns. For example, confidence at baseline and follow-up might appear as confidence_t1 and confidence_t2. This layout can be convenient for paired calculations and some repeated-measures procedures.
In a long dataset, each respondent can occupy several rows, with a time variable identifying the occasion. The same person might have one baseline row and one follow-up row. A person identifier and occasion identifier should together uniquely identify the expected records.
Reshaping changes organization, not the underlying sample size. Forty people measured twice produce 80 records in a complete long file, but those records do not represent 80 independent people. Analyses must account for within-person relationships when the research question requires it.
Before and after reshaping, reconcile participant counts, occasion counts and key values. Check whether an incomplete follow-up became an empty row, disappeared or remained explicitly missing. Save the transformation syntax and preserve a version of the original layout for comparison.
Write scoring rules before calculating a total
A composite score requires a measurement rationale. Items should belong together because of the instrument and research construct, not merely because they appear next to each other in the questionnaire. Keep conceptually different domains separate unless the measure explicitly supports an overall score.
Start with the instrument’s published instructions and any permissions or licensing conditions. Identify reverse-scored items, sum versus mean scoring and any transformation to a different range. If instructions are unavailable, discuss the measurement problem with your supervisor before inventing a convenient total.
Specify the missing-item rule in advance. A score based on one of four items may not represent the same content as a score based on all four. A minimum completion requirement limits that inconsistency, but the chosen requirement still needs a defensible source or explicit rationale.
When an adaptation changes item wording, language or response categories, document it. Scoring a modified instrument exactly like the original does not automatically transfer the original measurement evidence to the modified version or a new student population.
Use SPSS syntax to make the rule reproducible
Create new scored variables rather than overwriting original items. Confirm missing-value definitions before recoding. Then verify the observed minimum, maximum and valid count for every derived item. A reversed variable outside its intended range usually signals a coding or missing-value problem.
IBM’s statistical-function reference explains the minimum-valid-argument suffix. For example, MEAN.3 requires at least three valid arguments; ordinary MEAN has a different default requirement.
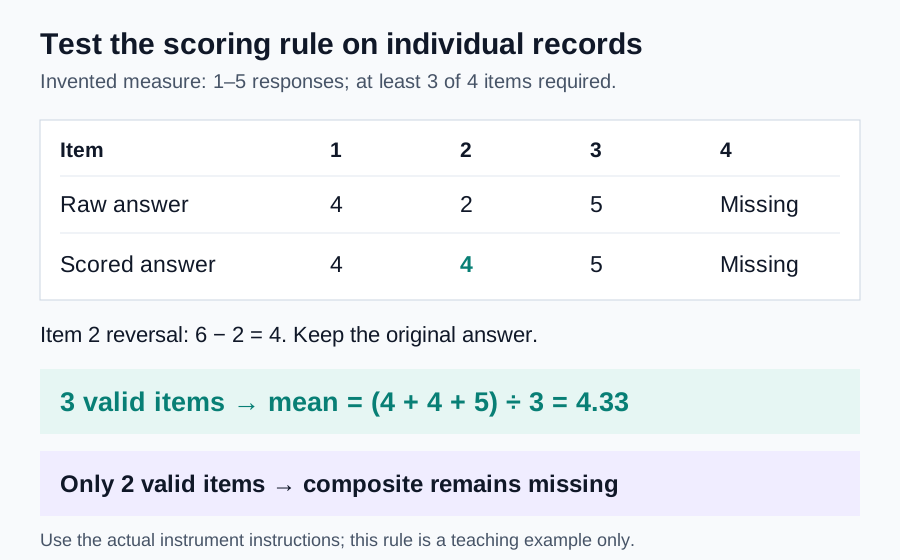
Suppose an invented four-item measure uses 1–5 responses and permits a mean when at least three items are complete. The second item requires reversal. After defining missing values and creating q2_r, a documented scoring command could be:
COMPUTE support_mean = MEAN.3(q1, q2_r, q3, q4).
VARIABLE LABELS support_mean 'Teaching example: support mean, minimum 3 items'.
EXECUTE.
This syntax is an illustration, not an instruction to apply that rule to every instrument. Check your installed SPSS version, variable types and actual scoring documentation. Keep the reversal command and validation checks with the final script so that the displayed mean can be reproduced.
Check the scoring rule with individual records
For an invented respondent, raw answers are 4, 2, 5 and missing. Reversing the second item on a 1–5 scale changes 2 to 4. The available scored answers are 4, 4 and 5, so the mean equals 13 ÷ 3 = 4.33 after rounding.
A second respondent answers 3, missing, 4 and missing. Only two items are valid, so the three-item minimum leaves the composite missing. Reporting a mean of 3.5 for that respondent would contradict the specified rule, even though the arithmetic itself is straightforward.
Manually check several records, including complete responses, reversed endpoints, exactly the minimum completion and too few valid items. Also check any special values such as 97 or 99. The software can execute a mistaken rule perfectly; validation tests whether the rule matches your intentions.
Separate missingness description from missingness treatment
First describe what is missing. Count unanswered items, structurally inapplicable items and unavailable follow-up measurements separately where possible. Then examine whether patterns vary across relevant groups or questionnaire sections. A sudden increase in missingness after a long block may warrant a different explanation from isolated omissions.
Treatment is a second decision. Complete-case analysis, permitted partial scoring and more advanced missing-data methods each rely on assumptions. None should be selected only because it produces the largest sample or most favorable result. Keep observed responses distinct from any values subsequently imputed.
A sensitivity analysis can compare a documented primary scoring rule with a reasonable alternative. Report changes in analyzed count, score distribution and substantive conclusions. Do not search dozens of rules and present the most convenient one as if it had been specified from the beginning.
Evaluate measurement without overstating validation
Reliability describes aspects of score consistency under a particular measurement setup. It does not by itself establish that a score measures the intended construct. High internal consistency can coexist with narrow content coverage, redundant questions or a mismatch between the instrument and your population.
Review evidence relevant to the interpretation you propose. This can include item content, factor structure, relationships with other measures and performance in the relevant population. Your dissertation may not have enough data to investigate every aspect; explain what was evaluated and what remains uncertain.
A factor analysis also needs an appropriate purpose and sufficient information. Do not add it simply to make the project look more advanced. For a broader treatment of instrument direction and measurement decisions, see the separate SPSS questionnaire analysis help guide.
Match statistical comparisons to the data-generating design
Once coding and scoring are stable, select analyses that answer the defined questions. Individual ordered responses, binary selections, counts and composite scores need not use the same model. Independence, repeated measurement and clustering also matter, even when the exported file looks like a standard spreadsheet.
A group comparison of an appropriate quantitative score might lead to ANOVA analysis. A question involving several predictors may require regression analysis. Neither method repairs an incorrect denominator, poorly constructed score or unsuitable recruitment process.
Specify primary comparisons and distinguish exploratory work. If you test many outcomes, groups or item combinations, consider how multiplicity affects interpretation. Report uncertainty and practical size alongside any significance results, and avoid treating a threshold crossing as a complete answer.
Report sample coverage and generalization limits
A survey of volunteers from one US campus cannot automatically describe all US university students. Likewise, including several UK respondents does not establish a representative US–UK comparison. Explain the recruitment frame, participation process and populations your evidence can reasonably describe.
Nonresponse is not just a count of unanswered invitations. Bias depends on whether participation relates to the quantities being estimated. A response rate alone cannot demonstrate the absence or size of that problem. Discuss relevant participation differences using evidence you actually possess.
If your study uses sampling weights, strata or clusters, preserve that information and choose procedures appropriate to the design. Applying a weight does not automatically make an ordinary convenience survey representative. Seek design-specific statistical guidance when your available information cannot justify the proposed generalization.
Turn the workflow into readable results tables
Begin results with respondent accounting and the analyzed sample. Follow with item descriptions or constructed scores relevant to each research question. Readers should be able to see how submitted questionnaires became the observations contributing to a particular table.
Use table notes to document response ranges, score direction, eligible groups and denominator changes. For select-all questions, explicitly state whether percentages refer to respondents or selections. For composite scores, identify the missing-item rule and the number of respondents with valid scores.
Write interpretations around the quantity estimated. “Among respondents answering the resource question, 54.5% selected tutoring” is more informative than “tutoring was the highest variable.” Keep raw software output in supporting materials where permitted, and present concise tables that answer your actual questions.
Frequently asked questions
Can I combine every questionnaire item into one score?
Not without a measurement justification. Different sections may represent distinct constructs, and some questions are descriptive categories rather than scale items. Follow instrument instructions and explain any newly proposed scoring structure before relying on its statistical results.
Why do my select-all percentages exceed 100%?
Respondents may choose multiple options. Percentages based on respondents can therefore sum above 100%. Check that the denominator includes the intended eligible group and label the table clearly. Percentages based on total selections describe a different quantity.
Should everyone with one blank answer be removed?
No universal deletion rule fits all questionnaires. The answer depends on routing, the required analysis and the instrument’s missing-item instructions. Document the decision and its consequences rather than deleting rows simply to make the file look complete.
Can consultation replace my responsibility for the dissertation?
No. Appropriate consultation explains decisions, provides reproducible analysis support and helps you understand output. You remain responsible for the submitted research, its interpretation and any required acknowledgment. Follow your university’s academic-integrity and data-sharing requirements.
Request SPSS questionnaire data analysis support
Prepare the questionnaire actually administered, anonymized response file, codebook, approved research questions and scoring instructions. Include routing rules, recruitment counts, questionnaire versions and supervisor comments. These materials make it possible to assess the work without guessing what the exported columns represent.
Visit our statistical consulting services to define the support required, review pricing factors, or request an analysis quote. Explain your US or UK institutional requirements and deadline. The aim is a transparent workflow you can understand, check and discuss, not a promise of particular results.