

Mediation analysis help should clarify a proposed explanation, not simply identify a PROCESS model number. A mediation model asks whether an association between a predictor and an outcome operates through an intermediate variable. That question requires careful thinking about measurement, timing, confounding, and uncertainty. A statistically detectable indirect association does not, on its own, establish a causal mechanism.
This guide explains a practical approach to mediation analysis in SPSS for dissertation and student research. It distinguishes mediation from moderation, works through an invented numerical example, and explains bootstrap intervals and conditional indirect effects. It primarily addresses students at US universities while also supporting UK master’s and doctoral researchers. Use it alongside your approved protocol and the documentation for your installed software.
Define the proposed process in ordinary language
Start with a sentence that identifies the predictor X, mediator M, and outcome Y. For example: access to study support may be associated with examination performance partly through academic confidence. Then explain why support would precede confidence and why confidence would precede performance. These are substantive claims about a process, not conclusions that automatically follow from three correlations.
Specify the population, measurement occasions, and scale of each variable. An intervention assigned before a semester differs from a student’s retrospective rating of support collected after the examination. Even when both are labeled support, they represent different exposures and permit different interpretations.
If the broader project is still being planned, read SPSS dissertation help. For the regression foundations behind many observed-variable mediation models, see regression analysis help. Understanding the component equations makes the final indirect effect easier to defend.
Mediation and moderation answer different questions
Mediation concerns an intermediate pathway. Moderation concerns whether an association varies across the values of another variable. Academic confidence might be a proposed mediator between support and performance. Employment hours might be a moderator if the support–performance association differs according to how much a student works.
The distinction is conceptual before it is statistical. A variable should not be called a mediator in one analysis and a moderator in another solely because one specification gives a smaller p-value. Its proposed role needs a theoretical and temporal explanation. The same measured variable can serve different roles in different research questions, but those questions must be stated clearly.
Conditional process analysis combines the two ideas. It examines an indirect effect that changes with a moderator. This can be useful, but it also increases model complexity and the information required from the sample. Begin with the process you want to investigate rather than requesting every available model.
Read a simple path model correctly
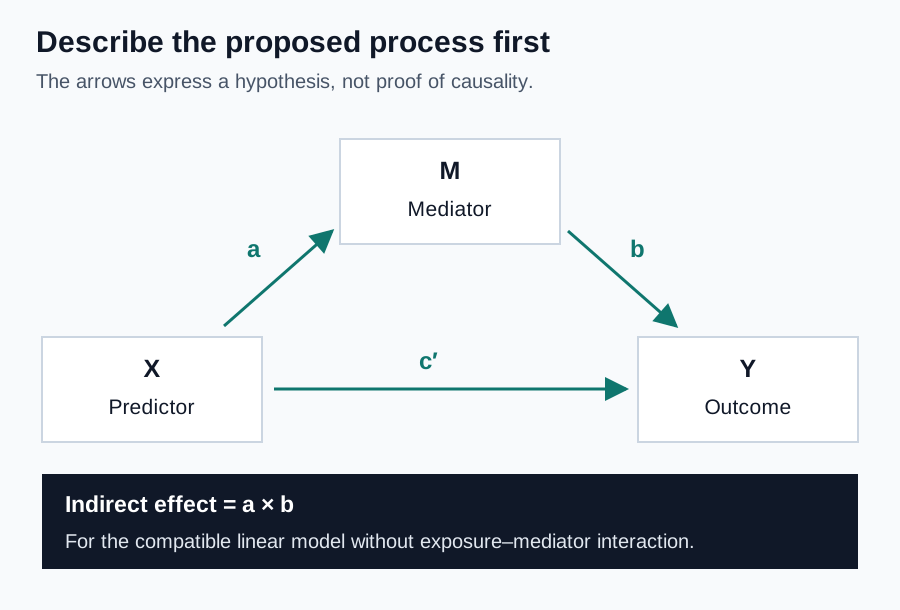
In a common linear model without exposure–mediator interaction, path a describes the association of X with M. Path b describes the association of M with Y after accounting for X and any specified covariates. Their product, a times b, is the indirect-effect estimate on the relevant outcome scale. Path c-prime describes X’s association with Y conditional on M.
Under a compatible linear specification fitted to the same observations, the total-effect coefficient c can be decomposed into c-prime plus a times b. That convenient equality does not automatically carry over unchanged to every nonlinear or interaction model. In logistic models, differences in scaling make casual comparisons of coefficients across equations particularly risky.
Write down both equations and identify their terms. This exposes ambiguous covariate placement, inconsistent samples, and mistaken coding early. A diagram is useful, but the arrows should be described as proposed relationships unless the design and assumptions justify stronger causal language.
Timing determines what the model can support
A mechanism unfolds in an order. Measuring X, M, and Y at the same time does not establish that order, even if your theoretical account is plausible. Performance could influence confidence, and confidence could influence how students remember support. Statistical adjustment cannot recover missing temporal information simply by drawing arrows in one direction.
Maxwell and Cole’s original study of cross-sectional mediation demonstrates that cross-sectional estimates can misrepresent longitudinal processes. A defensible dissertation should therefore explain the design’s temporal limitations instead of describing a single-wave indirect association as proof of how change occurs.
Longitudinal measurement can improve alignment with a process, but it is not a guarantee of causal identification. Choose measurement intervals that make substantive sense. Consider prior levels of relevant variables and the possibility that the process changes over time. A three-wave dataset still needs a carefully specified model and a justified account of confounding.
Make causal assumptions visible
A causal interpretation requires more than a significant bootstrap interval. Consider unmeasured common causes of X and M, X and Y, and M and Y. Also ask whether a variable affected by X creates confounding between M and Y. An ordinary regression adjustment may not solve that more complicated situation.
Randomizing X can strengthen inference about the exposure, but it does not ordinarily randomize M. Students with higher confidence may differ in prior attainment, motivation, or access to resources. Those differences can influence performance and complicate interpretation of the mediator–outcome relationship.
Use a causal diagram or a written assumptions table to explain what you measured, what remains unmeasured, and which claims depend on those choices. If causal assumptions are not supportable, describe the findings as model-based indirect associations. That wording is a substantive distinction, not a disclaimer to hide at the end.
Check measurement before estimating pathways
Clarify how each construct was measured and scored. A single item about confidence differs from a validated multi-item scale. Check response coding, reversed items, permitted score ranges, and rules for incomplete questionnaires. A coding error can change the sign of a pathway and create a misleading account of the proposed mechanism.
Measurement error can distort component paths and the indirect effect. Treating a scale average as an observed variable does not make it a latent-variable model. If measurement quality is central to the question, a model that explicitly represents multiple indicators may be more suitable.
Our SPSS questionnaire analysis guide covers scoring and reliability decisions. Do not use a favorable reliability coefficient as proof that a measure captures the intended construct or that its relationship with another variable is causal.
Prepare the dataset and the analysis sample
Keep the original data intact and document transformations in syntax. Confirm the unit of analysis, participant identifiers, missing-value codes, and plausible ranges. If participants are nested in classrooms or contribute repeated observations, a single-level model may not account for their dependence adequately.
Examine missingness across all variables used in both equations, not only the outcome. Two equations fitted to different subsets can complicate comparisons and decompositions. State the retained sample and how incomplete observations were handled. Missing-data methods must fit the analysis and software rather than being applied as an unrelated preliminary repair.
Remove direct identifiers before sharing files. A codebook should explain the remaining variables without including names, student numbers, email addresses, or unnecessary sensitive details. Our data cleaning guide provides an auditable preparation workflow that can be completed before model fitting.

Use PROCESS with version-aware decisions
PROCESS is an add-on analysis tool, so record its version separately from the SPSS version. Match the model specification to the research diagram, define variable roles carefully, and save the commands and output. A model number is not an explanation of the theory, estimand, covariates, or measurement timing.
The developer’s PROCESS FAQ explains important boundaries, including distinctions from latent-variable SEM and limitations involving multilevel models. It also warns about outdated templates. Consult current official documentation and the material accompanying your installed release instead of assuming that an older tutorial’s syntax or defaults still apply.
Before interpreting output, verify the case count, category coding, confidence level, resampling settings, and the equations actually estimated. Save the random seed if the procedure permits one so resampling results can be reproduced. Software acceptance of an input is not evidence that its distribution or design fits the intended statistical model.
Bootstrap mediation analysis: what an interval means
The product of two estimated coefficients can have an asymmetric sampling distribution. A bootstrap procedure repeatedly resamples according to a specified scheme and recalculates the estimate. The resulting distribution can support an interval without forcing the indirect effect into a symmetric normal approximation.
Specify the number of resamples, interval method, and confidence level. For an independent-person design, resampling complete cases preserves each person’s linked X, M, and Y values. Resampling individual cells independently would destroy those relationships. Clustered or dependent data require a resampling or inferential approach that respects the design.
A bootstrap does not manufacture representativeness, solve unmeasured confounding, or make an unsuitable model correct. With a small or highly unusual sample, repeated resampling of the same limited information can still produce unstable inference. Investigate data quality and the component regressions before treating an interval as the final answer.
An invented mediation example
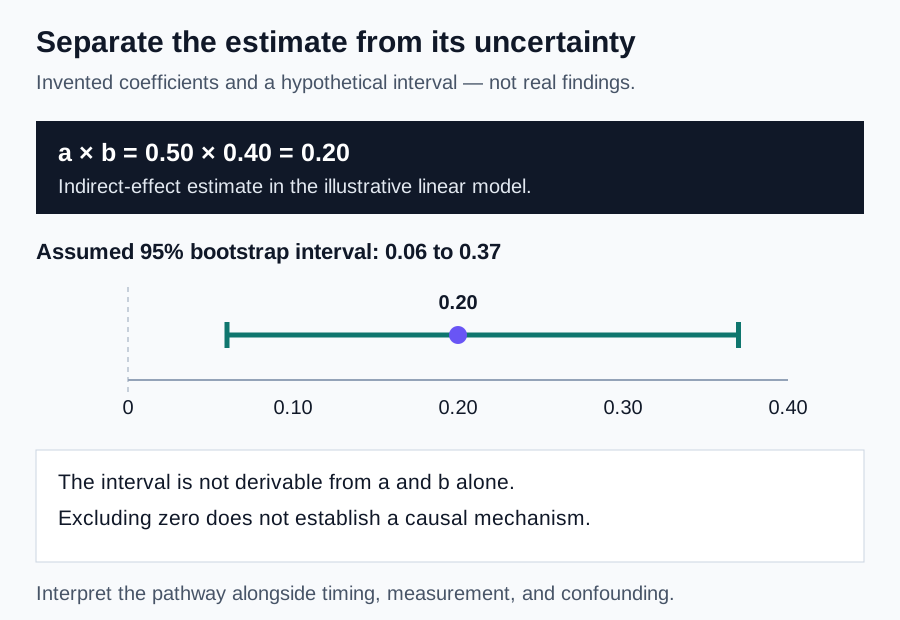
Consider an entirely invented study-support example using numerical support, confidence, and examination-score measures. Suppose the fitted X-to-M coefficient is a = 0.50. Suppose the M-to-Y coefficient, conditional on X, is b = 0.40. Their product is an indirect-effect estimate of 0.20 outcome points per one-unit difference in support.
Suppose the direct-effect coefficient is c-prime = 0.10. In this illustrative compatible linear model, the total-effect coefficient is 0.30 because 0.10 + 0.20 = 0.30. The indirect estimate describes the pathway represented in the model. It does not establish that changing confidence would cause the predicted examination-score change.
For illustration, assume a bootstrap analysis returned a 95% interval from 0.06 to 0.37 for the indirect effect. That interval is hypothetical, not calculated from a real dataset or derivable from the two path coefficients alone. Under the specified inference procedure, it excludes zero and supports a positive indirect association.
We still need the study design, sample size, measurement evidence, covariates, and diagnostics to assess the finding. An attractive path diagram cannot supply those missing details. These invented values are teaching aids and must not be copied into a dissertation as empirical results.
Do not require a significant total effect automatically
Different pathways can point in opposite directions. A positive indirect association can coexist with a negative direct association, leaving a small total association. Requiring a significant total effect as a universal preliminary gate can therefore miss a pathway that the research question specifically concerns.
At the same time, this is not permission to search across many mediators until one interval excludes zero. Define the proposed pathway and distinguish planned analysis from exploratory investigation. If you examine numerous mediators, models, and subgroups, describe the analytical search and consider the implications for uncertainty and multiplicity.
Avoid relying on the labels full mediation or partial mediation as the main conclusion. Whether a direct-effect p-value crosses a threshold depends partly on precision. Report the direct and indirect estimates with their uncertainty and explain their substantive meaning instead of reducing a process to a binary label.
Moderation analysis and conditional indirect effects
A moderated pathway allows a coefficient to depend on W. For example, the X-to-M association might be represented as a1 + a3 times W. If the M-to-Y coefficient b is constant, the indirect effect becomes the product of that conditional a pathway and b. Its interpretation therefore depends on the moderator’s scale and coding.
Choose moderator values with substantive meaning and adequate support in the data. A mean and one standard deviation below or above it can sometimes be useful, but these values are not automatically appropriate. For a bounded score or highly skewed moderator, meaningful observed values or percentiles may communicate the comparison better.
Hayes’s original paper on the index of moderated mediation develops an interval-based assessment for linear variation in an indirect effect. The important practical distinction is between estimating an indirect effect at one moderator value and testing whether that indirect effect changes across the moderator.
A difference between significance labels is not moderation
Suppose one conditional indirect-effect interval excludes zero and another includes zero. That pattern alone does not establish that the two indirect effects differ. Their estimates may be close, while their uncertainty differs. Use the relevant index, contrast, or other justified test of the difference for the specified model.
The same caution applies to separately analyzing US and UK subsamples, or full-time and part-time students. A significant pathway in one subgroup and a nonsignificant pathway in another is not itself a subgroup comparison. If group differences are central, plan a model and sample capable of assessing them directly.
Report the conditional estimates and their intervals alongside the formal assessment. Explain the scale on which the change is expressed. Avoid depicting a nonsignificant interval as a pathway that definitely disappears, especially where the data allow a broad range of possible effects.
Parallel, serial, and latent-variable models
Parallel mediation specifies more than one intermediate variable without imposing a sequence among them in the diagram. The specific indirect effect through one mediator is conditional on the rest of the specified model. Correlated measures and overlapping constructs can make those separate pathways hard to distinguish.
Serial mediation specifies an ordered chain, such as support preceding confidence, confidence preceding engagement, and engagement preceding performance. Each additional arrow makes another substantive and statistical commitment. Cross-sectional measurements do not establish the chain simply because the estimated product is different from zero.
Latent-variable SEM can explicitly represent measurement models, whereas ordinary observed-score mediation does not. Model-fit indices, measurement assumptions, and identification requirements then need attention. Choose the framework that fits the construct and design. Do not request SEM, AMOS, or SmartPLS merely because their diagrams look more sophisticated.
Report pathways with precision and restraint
A useful report identifies the proposed model, variable scales, sample, covariates, and missing-data approach. Present the component coefficients and direct and indirect estimates with the appropriate intervals. Specify the bootstrap settings and software versions. Distinguish the equations’ fit summaries from any assessment of the entire proposed process.
Describe the temporal and causal limitations prominently. If all measures were collected in one questionnaire, say so where you interpret the indirect association. Discuss plausible alternative explanations and measurement limitations without claiming that a sensitivity check proves their absence.
The APA quantitative reporting standards support transparent methods reporting. Include the information needed to reconstruct your mediation model.
Make sensitivity analyses answer a stated concern
A sensitivity analysis should investigate a specific vulnerability. You might examine whether a defensible alternative scoring rule changes the indirect estimate, or whether a clearly identified influential observation materially affects a pathway. Record the reason before deciding which result you prefer. The purpose is to reveal dependence on analytical choices, not to find a version that looks cleaner.
Keep the primary and sensitivity results together. Explain what remains stable, what changes, and which interpretation follows. If an estimate changes direction across reasonable specifications, readers need to know that. Repeating similar models cannot establish that all unmeasured confounding is absent, but it can make the limits of a particular conclusion more visible.
What to send for mediation analysis help
Provide the research question, a proposed diagram, hypotheses, anonymized dataset, codebook, scoring instructions, and measurement dates or occasions. Explain why each variable has its proposed role. Include existing syntax, output, supervisor comments, and any approved methods. State whether observations are repeated, clustered, weighted, or drawn from an intervention study.
We can help assess the specification, prepare reproducible commands, review diagnostics, and explain the resulting estimates. You remain responsible for understanding your work and following your university’s rules about external assistance. Consultation should support your own analysis and academic decisions, not provide fabricated evidence or undisclosed submission-ready work.
Check the statistical consultation pricing page or send a mediation analysis brief. Tell us whether you need planning support, an existing-output review, or help understanding a specific interval. Clear questions make the consultation more useful.
Frequently asked questions about mediation
Can I run mediation with cross-sectional data?
A software procedure may estimate the model, but the design limits interpretation. A single-wave analysis usually cannot establish the proposed temporal sequence. Explain the result as an indirect association under the stated model unless stronger causal assumptions are genuinely justified. Discuss alternative ordering and unmeasured common causes.
Does bootstrapping solve a small sample?
No. It offers a way to estimate uncertainty from the available information; it does not create new participants. Plan sample size for the expected pathway, desired precision, measurement quality, and model complexity. Simulation can be more informative than applying a universal minimum number to every mediation study.
Can you review my PROCESS output?
Yes. Send the commands, dataset, software versions, proposed model, and your interpretation together. A review should check what was actually estimated, which cases contributed, and whether the claims match the design. A significant result or an attractive diagram is not a substitute for that review.