

PhD data analysis help should strengthen the reasoning behind your doctoral research, not simply produce a larger collection of statistical tests. At this level, the central question is whether the evidence supports the claim you intend to make. That requires attention to the design, measurement, analysis choices, uncertainty and limitations together.
This guide is written primarily for doctoral researchers in the United States, with relevant considerations for UK researchers preparing a thesis and viva. It explains how to scope statistical consulting, manage committee or supervisor decisions and evaluate the resulting work. Its numerical example is invented for teaching. It does not describe a client study, claim a service success rate or promise dissertation approval.
Define the contribution before choosing the model
A doctoral contribution needs a clear relationship to the research question. More complicated software does not automatically produce a stronger contribution. Ask what the study will clarify: a population characteristic, an association, a mechanism, a prediction or an effect of an intervention. Each aim places different demands on the design and the analysis.
Write a short claim-evidence statement. For example: “The study will estimate how research support relates to doctoral persistence within the sampled institutions.” Then identify what would count as evidence for that statement and what the data cannot establish. This step exposes gaps between an ambitious introduction and a narrower dataset.
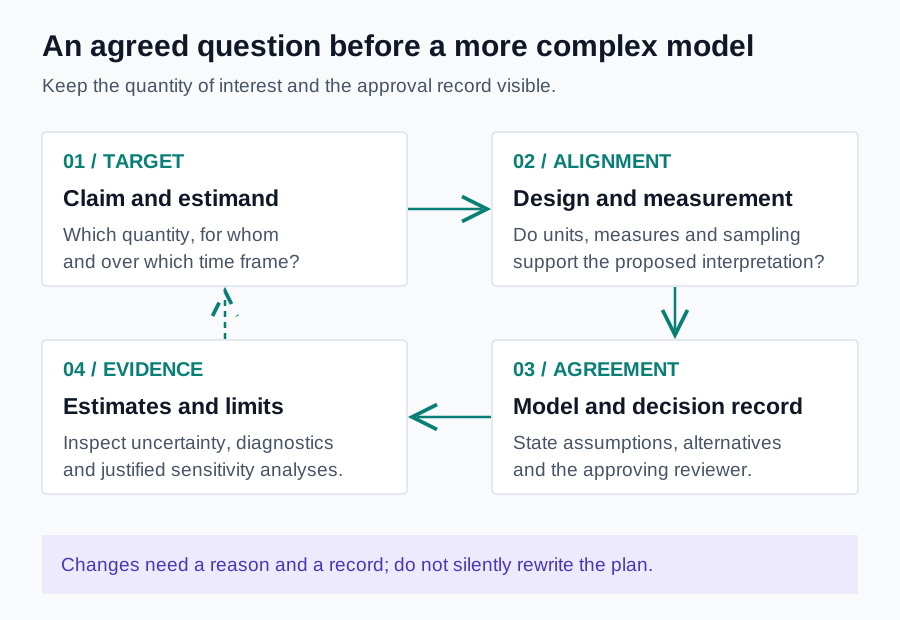
Discuss the statement with your committee or supervisor before expanding the analysis. A consultant can identify statistical concerns, but cannot approve a doctoral contribution on behalf of your program. Keep a record of which questions are settled and which remain provisional. A model built around an unresolved objective can create expensive rework.
Clarify the estimand: exactly what are you estimating?
An estimand is the quantity your study aims to estimate. It may be a mean difference, an adjusted association, a probability or a prediction error in a defined population. You do not need to use elaborate terminology in every paragraph, but you should be able to state the quantity precisely.
Identify the population, outcome, comparison, time frame and treatment of relevant events. “Student success” leaves many possibilities open. Completion by a particular date, a continuous achievement score and self-reported progress are different outcomes. Similarly, the average student and the average institution represent different targets when institutions have different sizes.
Distinguish the target quantity from the statistical estimator used to approximate it. A regression coefficient is not automatically the policy effect mentioned in your introduction. Your design and assumptions must support that interpretation. This distinction helps you ask better questions during consulting and explain why a numerical answer may still be incomplete.
Use a decision record to coordinate doctoral support
Doctoral projects often involve a chair, committee members, a methodological adviser and an external specialist. Their advice may differ because they are solving different problems. One person may prioritize the theoretical question, while another focuses on the properties of the observed data. Record those perspectives instead of reducing the disagreement to competing software commands.
A practical decision record has five fields: question, options, chosen approach, reason and approving reviewer. Add the date and whether the decision preceded access to the results. For a change made after inspecting data, explain what prompted it. This record is useful when preparing a methods chapter or answering questions months later.
Agree how new requests will be evaluated. A different table layout may be a presentation change; adding a new outcome may change the research scope. Do not let both appear as indistinguishable “revisions.” The SPSS dissertation help guide offers a practical intake checklist for communicating the basic project requirements.
Confirm the permitted role of an external analyst
Ask your program what statistical assistance is allowed and how it should be acknowledged. Doctoral independence does not mean you must never discuss methods, but it does mean you must follow the institution’s boundaries and accurately describe contributions. Do not assume that a commercial service can determine those boundaries for you.
Define the role in writing. A consultant might review an analysis plan, explain model diagnostics or perform an authorized analysis with a reproducible record. Your own responsibilities include the research argument, the decisions your institution requires you to make and an honest account of assistance. Concealing substantial contributions undermines that account.
For UK researchers, the UKRIO Code of Practice for Research provides a research-integrity framework that includes supervision and collaboration. Follow the requirements your institution adopts. For US researchers, consult your graduate school and committee rather than assuming that a policy from another university applies to your program.
Review ethics, permissions and the working dataset
Before granting external access, confirm that the proposed data use fits the relevant approvals and agreements. Human-participant research may involve restrictions that remain relevant even after direct identifiers are removed. The OHRP human-subject regulations decision charts explain parts of the US federal framework. Your IRB or research office should guide determinations for your own project.
Prepare the smallest authorized working dataset that supports the agreed analysis. Exclude names and contact details when they are unnecessary. Review combinations of variables that might identify a participant indirectly, particularly in small doctoral cohorts or specialist clinical populations. Redact free-text fields carefully rather than assuming a numeric ID guarantees anonymity.
Keep a record of what was shared, with whom and for what purpose. Ask about storage, access, retention and deletion arrangements before transferring files. If restrictions prevent sharing observations, consider whether a permitted syntax review, a synthetic example or an explanation of redacted output can address the immediate problem.
Inspect measurement before interpreting relationships
A model cannot rescue an outcome that does not represent the concept in your research question. Review how each construct was measured, scored and interpreted. For a questionnaire, document the items, response options, reverse coding and scoring rules. Explain whether you are using a previously established instrument or developing a new measure.
Reliability and validity answer different questions. Items can be internally consistent without capturing the intended construct. A scale can also behave differently in a new context from the setting in which it was developed. Discuss the evidence your doctoral claim needs instead of treating one reliability coefficient as a universal certification.
If you plan a latent-variable model, separate the measurement model from the structural relationships. Ask whether the sample, indicators and proposed parameters support the intended analysis. The questionnaire analysis guide explains the preparation questions, while the mediation analysis guide distinguishes proposed paths from established causal mechanisms.
Match the analysis to dependence and time
Repeated measurements and clustered observations create dependencies that a simple independent-observations analysis may not address. List the levels explicitly: visits within patients, students within programs or employees within organizations. Count observations and independent units separately. A dataset with many rows can still contain limited information about higher-level variation.
For longitudinal work, specify the time scale and what each occasion means. Unequal follow-up times, changing exposure status and dropout can affect the question. A baseline-to-final difference discards information differently from a model using all observed occasions. Neither approach is automatically right; explain the target and assumptions that justify the choice.
Discuss what the design cannot separate. A single institution cannot directly reveal between-institution variation. A small number of clusters may limit what you can estimate reliably. Ask whether the planned model needs simplification, a different interpretation or additional data rather than treating convergence as proof that the model is adequate.
An invented example: the average student versus the average department
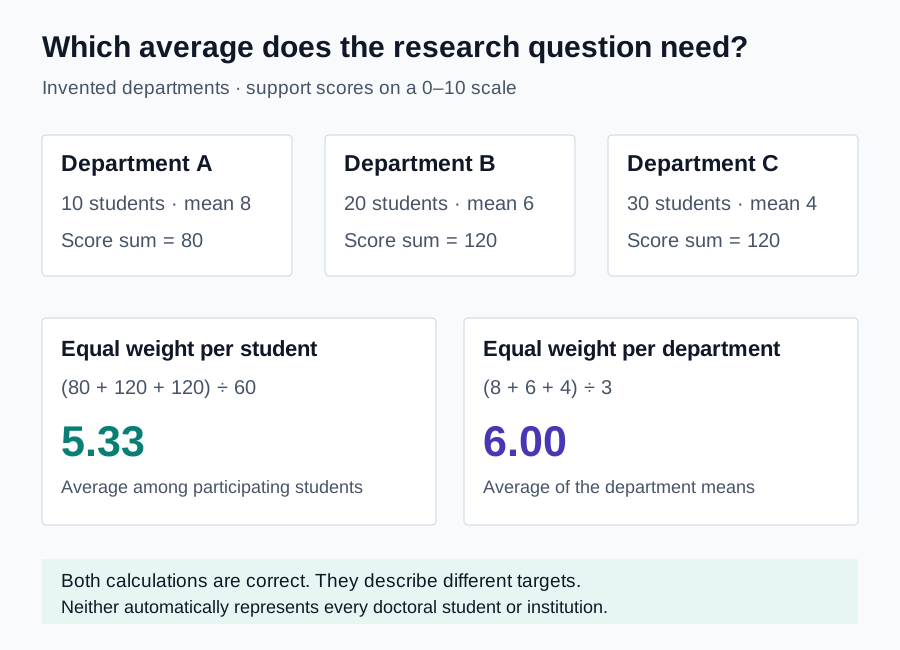
Consider an invented doctoral survey with three departments. Department A has ten participating students and a mean support score of eight. Department B has twenty participants with a mean of six. Department C has thirty participants with a mean of four. Scores are invented on a zero-to-ten scale.
| Department | Participating students | Mean score | Sum of scores |
|---|---|---|---|
| A | 10 | 8 | 80 |
| B | 20 | 6 | 120 |
| C | 30 | 4 | 120 |
The overall mean among participating students is the total score divided by sixty: 320 divided by 60, or approximately 5.33. The equally weighted mean of the three department means is six. Both calculations are arithmetically correct, but they summarize different targets. One gives each participating student equal weight; the other gives each department equal weight.
Neither value automatically estimates the average for all doctoral students in the country. Recruitment, response patterns and the sampled institutions still matter. Nor do three invented department summaries provide a basis for claiming that a complex multilevel model will be reliable. The lesson is to specify the unit and target before asking which output is “correct.”
Plan for missing data rather than hiding it
Summarize how much data are missing, where they are missing and what is known about why. A skipped questionnaire item differs from a participant leaving a longitudinal study. Inspect patterns by relevant groups and occasions when permitted. Do not treat an empty cell as interchangeable with a recorded zero.
Describe the assumptions behind the planned approach. Complete-case analysis changes the analyzed sample and may change its relationship to the target population. Imputation introduces its own modeling choices and uncertainty. No method eliminates the need to justify how missingness is handled.
Make the choices visible in the results. Report the number of observations used in the principal analysis and explain important differences across models. Consider a justified sensitivity analysis when the answer could depend on uncertain missing-data assumptions. For practical preparation questions, consult the data cleaning guide rather than silently replacing missing observations.
Distinguish explanation from prediction
An explanatory model and a prediction tool can use similar software while serving different goals. An explanatory question focuses on a defined relationship and the assumptions needed to interpret it. A prediction question asks how well a model estimates an outcome for observations beyond those used to build it. Strong fit to the development data does not settle that second question.
If prediction is part of your dissertation, plan an appropriate evaluation strategy before comparing many candidate models. Discuss how you will keep related observations together, prevent information leakage and report performance in relevant units. Repeated records from one person should not inadvertently provide information about that person to both model development and evaluation.
Do not relabel a model as predictive merely because it has a large R-squared value. State which performance question you tested, which data supported the evaluation and how the evaluation setting relates to future use. If the project is not designed for prediction, keep the interpretation aligned with the association or estimation question you actually investigated.
Use diagnostics and sensitivity checks as evidence
A diagnostic review should ask whether the chosen model represents the observed structure adequately for its purpose. For a linear regression, examine relevant residual patterns, influential observations and uncertainty in the coefficient estimates. IBM’s linear regression statistics documentation describes available coefficient, interval and model-fit output. Selecting an output option is not a substitute for interpreting it.
Separate a primary model from a sensitivity analysis. The primary model answers the agreed question under the stated assumptions. A sensitivity analysis asks how conclusions change under a specific alternative, such as a justified coding choice or treatment of influential observations. Explain why that alternative is informative rather than running many models without a plan.
Present disagreements honestly. If a conclusion changes materially under plausible alternatives, that instability belongs in the dissertation. It should not be hidden behind the most favorable model. A stable sign across models can be useful, but stability alone does not establish causation or rule out every source of bias.
Control the scope of multiple and exploratory analyses
Doctoral datasets often support more questions than the proposal originally listed. Distinguish confirmatory hypotheses from exploratory investigation. Record which outcomes and comparisons were primary before reviewing their results. If exploratory patterns suggest future work, describe them as such instead of rewriting the original hypotheses after the fact.
Discuss multiplicity in relation to the inferential family and research purpose. A collection of tests can increase opportunities for misleading findings when selection is ignored. Do not apply a correction mechanically without understanding which comparisons it addresses, and do not claim that correction makes every design problem disappear.
The ASA p-value statement emphasizes transparent reporting. Explain substantive importance separately from statistical significance when defending your doctoral findings.
Build a reproducible analysis package
A reproducible package should identify the input data version, preparation decisions, executable analysis instructions and the outputs used in the chapter. Include software versions and any required extensions or macros. Someone authorized to inspect the work should not need to reconstruct the project from screenshots and memory.
Test the package from its documented starting point. Open a fresh session, use the stated input and rerun the steps. Check that the resulting sample sizes and key estimates match the reported results. When the workflow requires manual steps, explain them clearly and assess whether they can be replaced by a repeatable operation.
The NIH guidance on rigor and reproducibility emphasizes transparent design, analysis and reporting in its grant context. This does not mean every dissertation is subject to NIH requirements. The practical lesson for your project is to make consequential choices inspectable rather than relying on confidence in a final document.

Write results that reconcile with the methods
Use the same variable definitions, hypotheses and analysis labels across chapters. If the final analysis differs from the proposal, explain the deviation and its reason. A methods chapter that describes one sample while the results silently use another leaves the reader unable to evaluate the evidence.
Organize the results around the research questions. Report sample flow and relevant descriptive information before the principal models. State units, reference categories, estimates and uncertainty. Put supporting diagnostics where they are useful, whether in the chapter or an appropriate appendix, instead of overwhelming the main argument with every generated table.
The APA JARS–Quant resources organize reporting guidance by design. Also follow your graduate school’s dissertation requirements.
Prepare for defense questions about uncertainty and limits
Practice explaining why you chose the model, what it estimates and which assumptions matter most. Then explain a limitation that could affect the conclusion. This is more useful than memorizing definitions without connecting them to your project. Use the actual decision record and output to support your answers.
Expect questions about generalizability. Describe who participated, who did not and how recruitment relates to the population you discuss. A large sample from a narrow source does not automatically represent a broad population. Be precise about the setting rather than adding a vague limitation at the end.
For a US defense or UK viva, know which work was yours and which assistance you received. You should understand the analysis well enough to discuss it honestly. If a question exposes a gap, acknowledge the gap and explain how you would investigate it; do not invent an answer to maintain an appearance of certainty.
Scope a consultation and budget for review
Request a consultation around a concrete decision or deliverable. Examples include reviewing the analysis map, checking a repeated-measure design, explaining diagnostic output or reproducing an authorized model. Provide the project stage, institutional boundaries and the relevant permitted files. Different tasks require different preparation and expertise.
Inspect the pricing page for the current ordering factors, then confirm how the agreed scope relates to your project. Pages and urgency alone do not describe every complexity. Ask how new committee requests, changed hypotheses and additional datasets would be handled before work begins.
Leave time to review the result yourself. Statistical consulting is not a replacement for committee approval, ethics review or your understanding. Explore the support areas and submit a permitted brief through the quotation form. Availability, suitability and the final scope require confirmation.
Questions doctoral researchers ask about statistical help
Do I need the most advanced available model?
No. Choose a method that answers the question and is supported by the design, measurements and information in the data. Complexity can add assumptions and instability. A simpler, well-justified analysis may be more informative than a complicated model you cannot estimate or explain adequately.
Can I change the analysis after data collection?
Sometimes a justified change is necessary, but document the timing, reason and approval. Preserve the original plan and distinguish exploration from confirmation. Discuss any implications for ethics or institutional permissions with the responsible office rather than assuming that statistical changes are purely technical.
What if my results are inconclusive?
Report the uncertainty and identify what the study can still contribute. Inconclusive evidence is not permission to invent findings, remove inconvenient cases or search endlessly for significance. Your discussion can explain limits and propose better-designed future research without claiming an answer your data do not provide.
Can a consultant guarantee that my committee accepts the analysis?
No responsible statistical process can guarantee an academic decision or a particular finding. Seek a clear scope, reproducible work and explanations you can evaluate. Your committee or supervisor retains its academic role, and you remain responsible for following your institution’s requirements.