

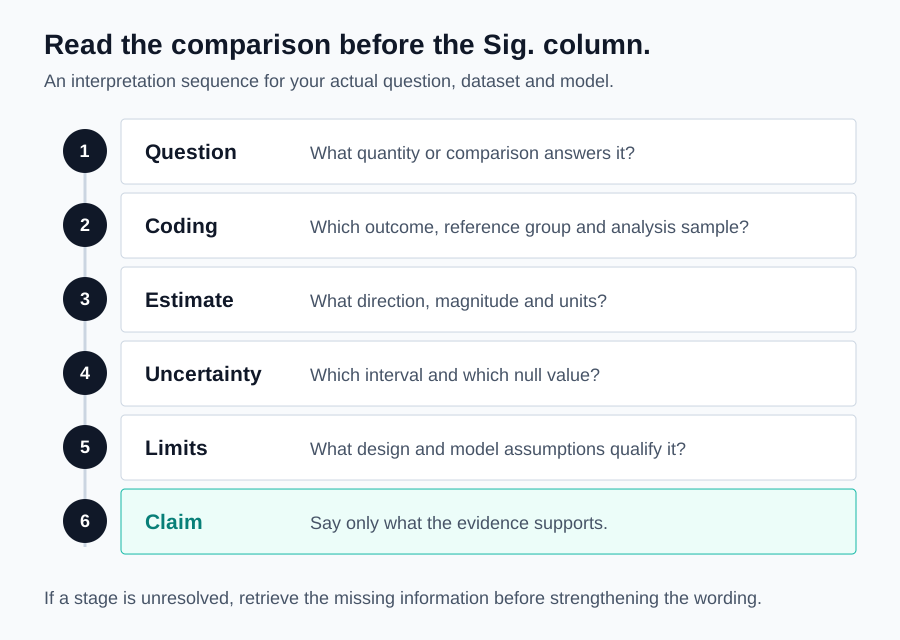
SPSS results interpretation help should begin with the question behind your output. A table can contain several correct numbers while still being misunderstood. The meaning of an estimate depends on variable coding, measurement units, reference groups, the analyzed sample, and the model that produced it. Reading only the Sig. column misses most of that information.
This guide explains how to read statistical output before turning it into dissertation claims. It is intended primarily for US students, with UK master’s and doctoral researchers also in mind. The examples use invented values and demonstrate reasoning, not results from real clients. Your approved analysis plan and institutional rules remain essential, particularly when you seek external statistical support.
What SPSS results interpretation help should answer
A useful interpretation identifies the target quantity, explains its direction and magnitude, and describes uncertainty. It also states the conditions under which the estimate is meaningful. For a comparison, that means knowing which groups are compared and in which direction. For a model, it means knowing which predictors are included and how their coefficients are defined.
Start with a one-sentence question: for example, how does examination score differ between students using two study formats? Next, identify the outcome scale and the comparison. Only then decide which output table answers the question. Software often produces descriptive summaries, diagnostic tests, omnibus tests, and parameter estimates in the same file. They are not interchangeable answers.
If the analysis itself has not been planned, read SPSS dissertation help first. If you understand the numbers but need to organize their presentation, Chapter 4 dissertation help focuses on the results chapter rather than the meaning of individual estimates.
Identify the dataset and settings behind the table
Check the active dataset, analysis date, syntax, and software version. Look for filters, split-file settings, weighting, and selected cases. A table created with a subgroup filter does not describe the full sample. An older output file can remain open after a dataset changes, so its presence in the viewer does not establish that it reflects the final analysis.
Match the number of observations to the relevant procedure. Different models can use different samples when their variables have different missing values. If a correlation uses 180 records but a regression uses 142, changes in the estimate may reflect both adjustment and sample composition. Make this visible before attributing the difference entirely to a statistical control variable.
Keep a small output-reading sheet: filename, dataset version, procedure, eligible sample, retained sample, exclusions, and unresolved questions. That record is particularly useful when several people collaborate on a dissertation. It makes interpretation an auditable process rather than a memory of which screenshot looked most convincing.
Read variable labels and coding before any coefficient
Confirm the score range, unit, and direction. An increase in a difficulty scale has a different substantive meaning from an increase in a wellbeing scale. Check whether totals, averages, transformed values, or standardized variables were analyzed. A coefficient of two may mean two test points, two percentage points, or two standard deviations, depending on the actual outcome.
For categorical predictors, identify the coding and comparison category. Codes such as 1, 2, and 3 do not automatically represent equally spaced quantities. Treating a category code as a quantitative predictor can impose a pattern that the research question never intended. Inspect the model specification rather than assuming a descriptive label guarantees correct handling.
IBM’s explanation of categorical predictors demonstrates how coding changes coefficient interpretation. A coefficient’s sign cannot be understood without knowing the direction of the coded comparison.
Distinguish standard deviation from standard error
A standard deviation describes variation among observed values around their mean. A standard error concerns the sampling variability of an estimator under a model. A sample can contain highly varied individual scores while estimating its mean fairly precisely. Conversely, a small and homogeneous sample can still provide limited information about another quantity of interest.
Read the column heading rather than relying on its position. Some tables show standard deviations next to group means. Others show standard errors next to adjusted estimates. Replacing one with the other in a dissertation changes what readers think the uncertainty describes. Label these quantities explicitly in a final table.
Do not interpret every error bar as a 95% confidence interval. A chart may show standard deviations, standard errors, confidence limits, or another range. Its caption should identify the interval and method. If the figure lacks that information, retrieve the plotting settings before drawing a conclusion from overlapping or separated bars.
Interpret confidence intervals carefully
An interval communicates the precision of an estimate under its statistical assumptions. A wide interval indicates that the data and model leave substantial uncertainty about the target quantity. Its width is not simply a measure of whether the study was performed well. Sample size, variability, measurement quality, design, and the estimator all influence precision.
NIST’s confidence-interval guide describes confidence through repeated sampling: a 95% procedure would cover the fixed population parameter in about 95% of repetitions under its assumptions. That is not a 95% probability assigned to a fixed parameter after observing one frequentist interval.
Inspect the interval on the correct scale. The no-difference value is zero for a mean difference or ordinary regression coefficient. It is one for an odds ratio or risk ratio. Checking an odds-ratio interval against zero would therefore answer the wrong question. Practical importance also requires a meaningful benchmark, not only whether an interval excludes a null value.
Read p-values without making them a verdict
A p-value summarizes how incompatible the observed statistic, or a more extreme one, is with a specified null model. It is conditional on assumptions and the analysis actually performed. It is not the probability that your hypothesis is true, the probability that the result happened by chance, or a direct measure of an effect’s importance.
SPSS may display .000 when a value rounds below the displayed precision. Do not report p = .000 as an exact probability of zero. Use an appropriate inequality, such as p < .001, when justified by the output precision and your required reporting style. Do not replace a displayed value with an invented number of additional decimal places.
A larger p-value does not prove that groups are equal or that an association is absent. Examine the estimate and interval. If both a meaningful effect and a small effect remain compatible with the data, explain the uncertainty. Formal equivalence or noninferiority questions require their own prespecified framework and cannot be settled by a nonsignificant ordinary test.
Understand unstandardized B and standardized beta
In a linear model, an unstandardized slope connects the predictor’s units to the outcome’s units. If examination score is measured in points and preparation time in hours, a slope describes the estimated point difference associated with one additional hour, conditional on the other modeled predictors. The coefficient does not automatically describe what would happen if a student were instructed to study longer.
IBM’s regression-statistics documentation distinguishes B, its standard error, standardized beta, t, and coefficient confidence intervals. Check the heading before copying a number into a sentence about score points.
A standardized coefficient uses standardized units and can aid some comparisons, but it is not a universal measure of importance. It depends on the variability of variables in the analyzed sample. Correlated predictors, measurement reliability, coding, and the question of interest complicate rankings based only on the largest absolute beta.
An invented linear regression example
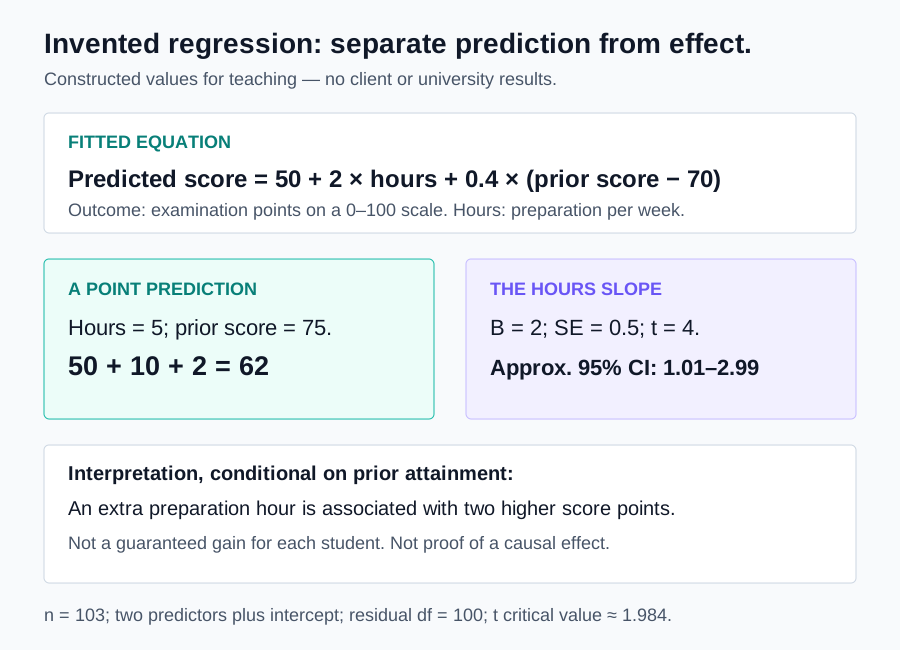
Consider an invented model predicting a zero-to-100 examination score. Preparation time is measured in hours per week. Prior attainment is centered at 70 points, meaning that 70 has been subtracted from its original value. The fitted equation is predicted score = 50 + 2.0 × preparation hours + 0.4 × centered prior attainment. These values are constructed for teaching.
For a student reporting five preparation hours and prior attainment of 75, centered prior attainment is five. The predicted score is therefore 50 + 2.0 × 5 + 0.4 × 5 = 62. For another otherwise comparable predictor combination with six preparation hours, the fitted score is 64. The two-point difference follows from the hours coefficient, not from a change in the prior-attainment term.
Suppose the model contains 103 complete observations and two predictors plus an intercept. Its residual degrees of freedom are 100. If the hours coefficient has a standard error of 0.5, its t statistic is 4.0. Using a t critical value of approximately 1.984, its approximate 95% interval is 1.01 to 2.99 score points per additional hour.
Explain the example without changing the question
A careful interpretation states that one additional preparation hour is associated with an estimated two-point higher examination score after adjustment for prior attainment in this invented model. The interval describes uncertainty about that conditional slope. It does not claim that every student gains exactly two points or that preparation time caused the difference.
The intercept of 50 refers to zero preparation hours and prior attainment of 70 because that predictor was centered. Whether this is a useful real-world combination depends on the observed data. Avoid giving an intercept a substantive meaning when the all-zero predictor combination lies far outside the sample’s experience.
The point prediction of 62 is not a guarantee for an individual student. Individual outcomes can vary around the fitted mean. A confidence interval for the mean response and a prediction interval for an individual outcome answer different questions. State which interval you report instead of referring vaguely to the model’s “accuracy.”
Reference groups change the wording, not the underlying data
Suppose an invented linear model codes online delivery as zero and classroom delivery as one. A coefficient of three for delivery indicates a fitted classroom-minus-online difference of three outcome units, conditional on other modeled variables. Reversing the zero and one codes reverses the comparison direction and the slope’s sign.
UCLA’s parameter-estimation tutorial shows that different model parameterizations can yield different-looking coefficients while representing the same fitted comparisons. Confirm the contrast system before interpreting the label beside an estimate.
When a predictor has several categories, there are usually several coefficients under reference coding. Each concerns a stated comparison with the reference category. A p-value for one category is not automatically a test of the predictor as a whole. Look for the appropriate overall test when that is what your research question asks.

Odds ratios are not probability ratios
Binary logistic regression models a two-category outcome on a log-odds scale. Its exponentiated coefficient is commonly interpreted as an odds ratio. Confirm which outcome category is modeled as the event. A positive coefficient can mean greater odds of an undesirable event if that event is coded as the modeled category.
In a separate invented example, let the reference probability be .20. Its odds are .20 divided by .80, or .25. An odds ratio of two gives comparison odds of .50. Converting those odds back to probability gives .50 divided by 1.50, or approximately .333. Doubling the odds therefore does not double the probability from .20 to .40.
The probability change depends on the starting probability and the full model. An adjusted odds ratio alone does not tell you a universal percentage-point increase for every participant. If the question concerns predicted probabilities, calculate and label predictions for defined covariate combinations, with an appropriate uncertainty method.
Separate model fit from useful interpretation
R squared describes a particular aspect of variation accounted for by a fitted linear model in the analyzed sample. It is not the percentage of cases predicted correctly, and a high value does not establish causality. A model can fit existing observations well while predicting new observations poorly.
Adjusted R squared accounts for the number of predictors in a particular way, but it does not cure overfitting or select the scientifically correct adjustment set. Adding variables because they improve a fit statistic can change the question and produce unstable estimates. Model development decisions require substantive reasoning as well as numerical comparisons.
Classification accuracy in a binary model also needs context. If 95% of observations are non-events, a rule that always predicts the non-event class is 95% accurate while identifying no events. Examine the evaluation design, threshold, class balance, calibration, and relevant performance measures rather than promoting a single attractive percentage.
Interpret interactions as conditional associations
An interaction asks whether an association differs across values of another predictor. In a linear model containing preparation hours, delivery mode, and their product, the hours coefficient is conditional on the delivery reference category. It is not automatically the average hours association across every student in the sample.
Explain an interaction with defined comparisons or predictions. State the moderator values and hold other predictors at explicitly identified values where appropriate. A graph can help, but its axes, units, intervals, and observed range must remain clear. Do not extend a line far beyond the data simply because the plotting software permits it.
A significant association in one subgroup and a nonsignificant association in another does not itself establish an interaction. Their difference requires a suitable direct comparison. Our regression analysis guide covers model specification, while mediation analysis help distinguishes conditional effects from indirect-effect questions.
Read correlations, group tests, and reliability in context
A correlation describes an association in a particular sample and under a particular definition. It does not establish a causal direction. Check the scatterplot, scale, sample size, and missing-data handling. Pearson and rank-based correlations can answer different questions. A near-zero linear correlation can coexist with a strong nonlinear pattern.
An omnibus ANOVA result concerns the model’s overall group comparison. It does not identify every pair that differs. Pairwise results depend on the contrasts, adjustment method, and variance assumptions. For a focused explanation, see ANOVA analysis help. Do not infer a significant pair merely from separated sample means.
A reliability coefficient concerns a measurement property under stated conditions. It is not proof that a questionnaire measures the intended construct or that every item should be retained. Check scoring, dimensionality, and the interpretation required by the instrument. Statistical labels can look reassuring while leaving the important measurement question unanswered.
Use diagnostics to qualify, not decorate, the interpretation
Ask whether the model’s assumptions and data structure support its standard errors and tests. Residual patterns, influential observations, dependence, sparse categories, and misspecification can matter. A familiar table format does not imply that the fitted model is appropriate. A model may require reanalysis before its coefficients deserve a polished explanation.
When diagnostics raise a concern, explain its likely consequence and any sensitivity analysis. For example, compare the relevant estimate under a justified alternative rather than announcing that an assumption was “fixed.” Keep the scientific question consistent when comparing models. Different outcomes, samples, and coding schemes can make a numerical comparison misleading.
If an unusual record reflects a data-entry error, document the correction. If it is a genuine observation, deleting it requires a defensible rule rather than discomfort with its effect. Retain an audit trail. Our data-cleaning guide explains how preparation decisions affect what an output table ultimately represents.
Turn an output review into a useful consultation
Send the research questions, anonymized dataset where permitted, codebook, syntax, and complete relevant output. Include the analysis plan and the exact statements you cannot explain. A cropped table can hide a footnote, reference category, or sample-size change. Indicate whether the task is interpretation, model checking, or a decision about further analysis.
Useful support can include annotated output, an estimate-by-estimate explanation, a coding check, and a discussion of limitations. You should be able to describe the main result in your own words afterward. US and UK institutions have different policies on outside assistance; check your program’s rules and disclose permitted consulting where required.
We do not promise favorable findings, grades, or a completed dissertation to submit as your own. A transparent review can identify that the current analysis does not answer the question. Browse our statistical consulting services, review pricing factors, or request an SPSS output consultation with a clearly scoped brief.
Frequently asked interpretation questions
Can you interpret output without my dataset?
Sometimes a limited explanation is possible from complete tables and a detailed codebook. It cannot verify hidden filters, transformations, exclusions, or diagnostic decisions. A responsible review distinguishes what the supplied materials establish from what remains unknown. More confident wording is not a substitute for missing evidence.
Should my interpretation repeat every table entry?
No. Identify the result answering the question, explain the estimate and uncertainty, and direct readers to supporting detail. Preserve important qualifications and contrary results. A concise explanation can be more informative than several pages that repeat software headings without explaining what the numbers mean.
Why did a coefficient change after adjustment?
The adjusted model conditions on additional variables and may use a different complete-case sample. Correlations among predictors, coding, interactions, and model scale also matter. Compare models systematically. Do not automatically call every change evidence of mediation, confounding, or a mistake.
What is the final check before writing a claim?
State the outcome, comparison, units, sample, adjustment, estimate, uncertainty, and limitation in plain language. Then point to the exact output supporting each component. If one component cannot be identified, pause before making the claim. Good interpretation connects a number to a defined question without pretending that the number answers more than it does.