

SPSS data cleaning services address the work between receiving a dataset and trusting an analysis. That work includes checking structure, coding, missing values, unusual observations, and the transformations needed for your research questions. A clean-looking spreadsheet can still contain errors that change a dissertation’s results.
For students in US graduate programs, the preparation stage should align with the approved proposal, institutional review requirements, and committee expectations. The same principle applies to UK dissertations and theses. Cleaning decisions belong in an auditable research process, not in an undocumented attempt to make assumptions pass.
This guide explains what to inspect, what to preserve, and how to hand over a dataset for statistical consultation. The examples are invented for teaching. They do not describe actual clients, and the suggested checks cannot establish that any particular dataset is error-free.
Define what a usable dataset must contain
Begin with the study design and research questions. Specify the unit represented by each row, the variables needed for each planned analysis, and the eligible sample. A cross-sectional student questionnaire needs a different structure from repeated clinical measurements or linked administrative records.
Write a small data specification before editing anything. Include expected column names, allowed values, measurement units, date conventions, and identifiers. If a score should range from 0 to 40, that range becomes a check. If follow-up measurements require baseline participation, that relationship becomes another check.
Distinguish “available” from “required.” An export may contain dozens of platform variables, but only some are relevant to your analysis or quality checks. Retain necessary provenance while avoiding unnecessary personal information in files shared for support.
The cleaning plan should also state which decisions can be automated and which need researcher judgment. A text value in a numeric age field is an obvious issue. Whether an unusually high but possible age belongs in the target population requires knowledge of the study.
Preserve the source and create a reproducible working copy
Keep the original export unchanged. Give it an informative name and store it separately from working files. Record the source, export date, file format, and any platform filters used to obtain it. If your project receives updated extracts, preserve each version rather than repeatedly overwriting one file.
Create a working dataset for transformations. Maintain a syntax file that imports the data, labels variables, checks values, and creates analysis-ready fields. A second researcher should be able to rerun those steps without needing your memory of several manual clicks.
Use a simple folder structure: source data, syntax, working data, final analysis data, output, and documentation. Access restrictions should reflect the sensitivity of the files. A more elaborate structure is not automatically better if nobody can identify the final version.
Save an issue log alongside the syntax. Record the affected variable or case, the problem, the decision, its justification, and the date. When a supervisor asks why the analyzed sample differs from an earlier draft, that log provides a concrete answer.

Check imports before interpreting any numbers
Import problems often look like research findings. A decimal separator can turn a numeric column into text. Leading zeros can disappear from identifiers. A date may be interpreted as month/day/year when the source used day/month/year. Examine these possibilities before describing the sample.
Compare row and column counts with the source file. Inspect several records from the beginning, middle, and end. Select examples containing blanks, special characters, dates, and large values. Verify that long response text or variable labels have not been truncated.
For CSV files, check encoding, delimiters, quote handling, and the first row. For Excel files, confirm that the correct worksheet and range were imported. A spreadsheet’s visible formatting does not necessarily reflect its stored cell types.
In SPSS Variable View, inspect type, width, decimals, labels, missing values, and measurement level. A variable labeled “scale” is not thereby validated for a quantitative model. Those settings support analysis, but the questionnaire, collection process, and scientific meaning determine how the data should be treated.
Identify the correct key before checking duplicates
A participant identifier may appear more than once for legitimate reasons. In a longitudinal dataset, the combination of participant and visit could be unique even when participant alone is not. In a household study, several people may share a household identifier.
Define the key that should identify one row. Then check repeated keys, missing keys, and disagreements among records sharing a key. Investigate whether the issue represents a repeated submission, a valid repeated observation, or an accidental merge problem.
IBM’s duplicate-case documentation explains how SPSS flags matching cases using selected variables. The definition you supply determines what is flagged; the software does not decide whether those records are scientifically redundant.
Do not retain the first record simply because it appears first in a sorted file. A defensible rule might prioritize the completed eligible response or the verified source record. Document the rule and preserve the excluded records outside the final analytical sample.
Audit category codes and labels
Run frequency tables for categorical and ordered variables. Look for spelling differences, trailing spaces, inconsistent capitalization, and unexpected numerical codes. “Full-time,” “Full time,” and “full-time ” may represent the same response category while appearing as separate values.
Standardization should follow meaning. Two labels that look similar may represent different questionnaire versions. Conversely, a valid label change may require combining categories. Check the collection instrument rather than guessing from the exported text.
Keep missing categories distinct from substantive categories. “No,” “none,” “not applicable,” and an unanswered question are not interchangeable. A frequency table that silently combines them can change both the denominator and the interpretation.
If you convert text to numeric categories, retain a mapping table. Make reference categories explicit for later regression models. Alphabetical automatic coding can change when new categories appear, so do not rely on an undocumented code order remaining stable across exports.
Find impossible combinations, not only impossible values
Range checks identify values outside plausible limits. Logical checks identify combinations that cannot fit the study design. A follow-up date before enrollment, a reported total smaller than one of its components, or a response to a question that should have been skipped may require investigation.
Some apparent contradictions have legitimate explanations. A participant may report zero current work hours but positive annual income. A student may be enrolled in more than one program. Verify the time frame and question wording before deciding that the record is wrong.
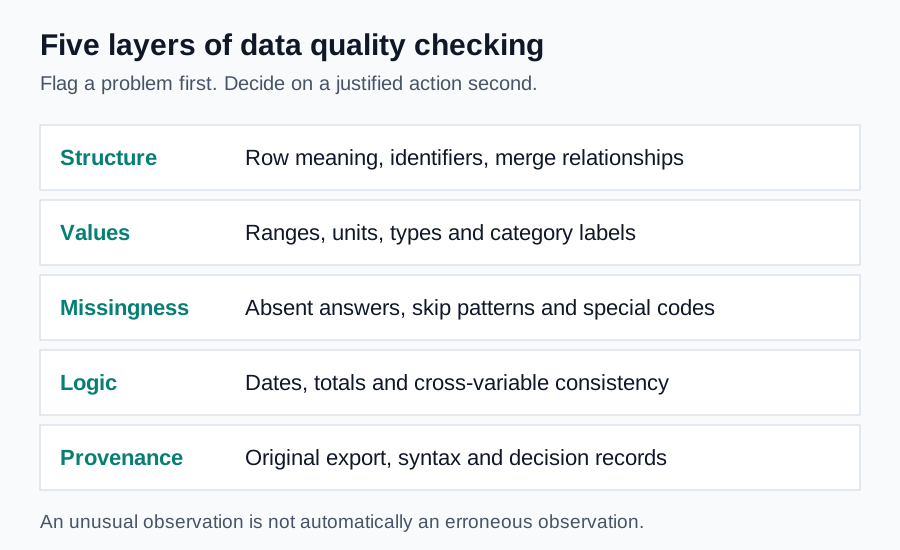
Build checks around explicit rules. For each flag, count how many records are affected and inspect the relevant fields together. A flag is a request for review, not an instruction to delete the case.
When you can verify a correction against an authorized source, record that source and the change. When you cannot verify it, preserve the uncertainty. Choosing the value that makes the final model look better is not a defensible correction method.
Handle missing data as an analytical question
First identify which values are missing and why they might be absent. Differentiate system-missing values, user-defined missing codes, structural skips, and values rendered missing by an invalid transformation. Check missingness by variable and by case.
A complete-case analysis uses only records with the required observed values. It may substantially reduce the sample and can change which population the analysis represents. Report the resulting sample size for each model rather than repeating the original recruitment total everywhere.
Multiple imputation can be appropriate under a defensible missing-data model, but it is not an automatic repair. It requires decisions about included variables, model compatibility, plausible bounds, and sensitivity to assumptions. Structural non-applicability should not simply be filled as though a response should have existed.
IBM’s multiple-imputation documentation describes how SPSS creates multiple completed datasets. Check which procedures support pooled analysis in your version; analyzing one completed dataset alone does not represent the full imputation process.
Simple mean replacement generally hides uncertainty and changes relationships among variables. Before choosing any method, discuss the likely reasons for missingness and the consequences for your research question.
Investigate outliers without deleting inconvenient observations
An unusual value can be an error, a valid extreme observation, or evidence that the model is unsuitable. Start by checking the source, units, and coding. A reported height of 170 might be centimeters entered into a column expected to contain meters.
Use plots alongside numerical flags. Histograms, boxplots, and scatterplots reveal different patterns. An observation may be ordinary on each variable separately yet unusual in their joint relationship. Influence on a model is also different from being far from a variable’s mean.
NIST’s outlier guidance distinguishes investigation of unusual points from automatically discarding them. A valid extreme observation may contain important information rather than being a mistake.
If an exclusion is justified, state the rule and its effect. Where scientifically appropriate, compare results with and without the observation, or consider a model less sensitive to the relevant problem. Explain material changes instead of selecting whichever analysis gives the preferred conclusion.
Recode and derive variables transparently
Use new variables for substantive recoding whenever practical. Preserve the original and give the derived field an informative label. Record the exact mapping, including how valid categories, missing values, and unexpected values are handled.
For example, an age grouping might place valid ages 18–24 in one category and 25–34 in another. Define both boundaries clearly. Check the newly created frequencies against the original distribution, particularly the boundary values 24 and 25.
SPSS recode ranges require care with missing-value definitions. IBM’s numeric RECODE reference explains how special range keywords interact with user-missing and system-missing values. Explicit rules are safer than assuming that every special code is excluded automatically.
Derived scores need similar checks. Verify reverse coding, minimum item completion, possible ranges, units, and arithmetic. If you calculate a rate, check for zero denominators. If you transform an outcome, explain why the transformation addresses the analytical problem and how results will be interpreted.
Check merges and reshaping operations
Merging files can introduce errors that no normality test will reveal. Establish the expected relationship between files: one-to-one, one-to-many, or another defined structure. Confirm that the merge key is present, correctly formatted, and unique where required.
Before merging, count rows and unique identifiers in each file. After merging, count matched and unmatched records and inspect examples from both groups. An unexpected increase in rows can indicate duplicate keys or an unintended many-to-many join.
Reshaping between wide and long formats also changes the meaning of a row. In wide format, a person may have separate baseline and follow-up columns. In long format, that person has separate rows with a time indicator. Verify that each value moved to the correct person and time.
Keep a small comparison table showing the expected and actual record counts at every stage. If the count changes, give a reason. This simple habit often catches serious structural problems before they reach the final statistical models.
Invented example: a cleaning log for a student survey
Imagine an export of 120 survey records. Review identifies three test submissions created before recruitment, two confirmed repeated submissions from the same respondents, and one record outside the approved eligibility criteria. Suppose those six records are excluded under documented rules, leaving 114 eligible unique responses.
The remaining file contains a missing-response code of 99 in a 1–5 item. Defining 99 as missing changes the valid denominator for that item; it does not remove the entire participant automatically. Another item requires reverse scoring under the instrument’s instructions.
One respondent reports 90 weekly study hours. That number is unusual but not self-evidently impossible. The analyst flags it, checks the question’s time frame, and records whether verification is available. The teaching example does not prescribe deleting it.
The final log separates eligibility exclusions from item-level missingness and unresolved unusual values. That distinction helps explain why a model using several variables may analyze fewer than 114 cases. The numbers here are invented arithmetic, not evidence about a real survey.

Check active filters, weights, and split-file settings
A dataset can contain the correct records while SPSS analyzes only part of them. A filter left active from an earlier task may exclude eligible cases. Split File can produce separate output for groups when you intended one overall analysis. An unintended weight can alter counts and estimates.
Before rebuilding final output, explicitly establish the intended settings in your syntax. If you are not using a filter, split analysis, or weight, verify that each is inactive. If you are using one, record its purpose and check the resulting sample against your plan.
Weights deserve particular attention. A frequency weight representing repeated identical records is not interchangeable with a survey sampling weight. The appropriate procedure and standard errors depend on the study design, not merely on whether a column named weight exists.
Keep a brief analysis-start checklist with the active dataset name, current case count, intended settings, and final syntax version. When output unexpectedly changes, inspect that checklist before assuming that the data themselves changed. This is especially useful when several datasets remain open during a long dissertation session.
Cleaning does not replace model diagnostics
A valid dataset can still produce a poorly fitting model. Cleaning addresses the accuracy, structure, and documented meaning of the observations. Model diagnostics examine whether a proposed analytical model adequately represents relevant features of those observations.
For regression, investigate residual patterns, influential observations, and the appropriateness of the outcome distribution. For group comparisons, consider independence, group sizes, variance behavior, and the quantity being compared. The relevant checks depend on the procedure and design.
Do not repeatedly alter valid observations until every assumption test becomes nonsignificant. Large samples can reveal small deviations, while small samples may fail to detect substantial problems. Numerical tests, plots, subject knowledge, and sensitivity analyses belong together.
The regression analysis guide and ANOVA analysis guide explain model-specific decisions. Keep their diagnostic conclusions separate from the cleaning log so readers can distinguish a data correction from an analytical choice.
Protect research participants when sharing files
Send only the information needed for the agreed work. Remove direct identifiers and unnecessary sensitive fields. Review free-text responses, which can contain names or identifying events even when obvious identifier columns have been removed.
Use an authorized transfer method and follow institutional instructions. US researchers should consult their IRB or research office about data sharing; UK researchers should follow their university’s ethics and data-protection processes. This guide is not a legal determination about your dataset.
HHS guidance on coded research information explains why coding and identifiability are not interchangeable concepts. A linking key or other available information can matter. Obtain institutional advice rather than assuming that replacing names with numbers is sufficient.
What should a data-cleaning handover include?
A useful handover contains the documented analysis dataset, reproducible syntax, updated codebook, and decision log. It should identify unresolved issues, sample exclusions, derived variables, and any assumptions about missing data. The original source remains separate and unchanged.
Request summary checks that relate to your study: permissible ranges, missingness, duplicates, eligibility, score distributions, and record counts after merges. An unexplained “cleaned” file is difficult to audit, even if the analyst worked carefully.
If the work includes preliminary models, request estimates with suitable uncertainty measures and a clear statement of what remains provisional. A cleaning service cannot guarantee significance, successful hypothesis confirmation, committee approval, or that a convenience sample becomes representative.
Frequently asked questions
Can you clean an Excel or CSV file for use in SPSS?
Those formats are common starting points. The important requirements are a clear record structure, variable definitions, and an explanation of special codes. Include a blank questionnaire or collection form when the column labels alone do not establish meaning. Import checks should precede any transformations.
Should I remove every incomplete questionnaire?
No universal rule applies. A respondent may provide useful information for some questions but not others. Follow eligibility rules, instrument scoring instructions, and the planned missing-data strategy. Report the sample used for each analysis and explain substantial differences.
Can cleaning make my data normally distributed?
Cleaning should correct genuine errors, not force observations into a desired shape. Some variables are naturally skewed or discrete. A suitable transformation, robust method, or different model may address the analytical issue, but each changes the assumptions or interpretation and needs justification.
What if an error is discovered after analysis?
Correct the documented source issue, rerun the reproducible workflow, and compare affected outputs. Update the decision log and tell your supervisor about material changes. Do not patch only the final table while leaving inconsistent syntax, figures, or chapter text elsewhere.
Prepare your data-cleaning brief
List the study design, source files, expected sample, approved research questions, and known problems. Include a codebook and anonymized example records if you are unsure whether the full dataset can be shared. Identify your deadline without omitting necessary ethical or methodological checks.
Review pricing and scope options, then request data-preparation support. If your data come from a survey, continue with SPSS questionnaire analysis help. For a wider project plan, see SPSS dissertation help. The final goal is a dataset whose structure and decisions you can explain, not simply a file that produces output without warnings.