

SPSS data analysis help should make the route from your research question to your results understandable. The task is not simply to produce output. You need to know which records entered each analysis, what the variables mean, and which decisions shaped the findings.
A spreadsheet, an SPSS data file, and a long output document can describe different stages of the same project. Without a clear connection between them, a plausible table may answer the wrong question. A useful consultation therefore begins with the analytical brief and ends with a traceable handoff.
This practical guide follows that workflow. It covers dataset structure, active software settings, test selection, missing observations, reproducible syntax, and review. It is intended for students and researchers, including those preparing dissertations in the USA and UK. All numerical examples below are invented teaching examples, not client results.
Start SPSS data analysis help with an analytical brief
Write the research question in ordinary language before naming a statistical test. State the population, outcome, comparison or association, and relevant time frame. “Compare questionnaire scores between two independently recruited groups at baseline” contains more useful information than “run a t-test.”
Then describe how participants or records entered the study. Note whether allocation was random, recruitment was convenient, or observations came from existing records. Mention repeated measurements, shared classrooms, hospitals, households, or other structures that might create dependence.
Separate required analyses from optional questions. Your approved proposal may identify one primary outcome and several secondary outcomes. Preserve that distinction rather than treating every available column as an equally important hypothesis.
A short brief can contain the research questions, variable names, study design, proposed analyses, and reporting requirements. Add unresolved decisions in a separate column. For instance, identify an uncertain score calculation instead of presenting it as settled.
Finally, agree on the purpose of the support. You might need preparation, a methods discussion, a reproducibility check, or an explanation of existing output. Those tasks require different inputs and deliverables.
Define what one dataset row represents
The unit of a row is a statistical decision, not just a spreadsheet convention. One row might represent a person, a person at one visit, a school, or a questionnaire response. Write that definition explicitly.
Suppose each participant appears at baseline and follow-up. Repeated participant identifiers may be expected in a long-format file. Treating those rows as unrelated people would misrepresent the design. Conversely, deleting them as duplicates would discard legitimate measurements.
Identify the fields that should uniquely identify one observation. In a visit-based file, this could be participant identifier plus visit number. Check missing keys and repeated combinations before merging or modeling.
Describe any higher-level grouping alongside the row definition. Students within the same classroom can share influences even when each student has a unique identifier. The analysis may need to account for that structure.
Retain a simple diagram or written example of the intended structure. A small, de-identified illustration often prevents more confusion than an unfamiliar collection of variable names.
Build a codebook that explains the variables
A useful codebook links each field to its meaning, source, units, permitted values, and missing-value rules. Include the questionnaire wording or record definition where relevant. Abbreviations that seem obvious today may be unclear during final review.
Distinguish identifiers from measured quantities. A participant identifier coded 1001 is not a numerical outcome merely because it contains digits. Similarly, category codes do not automatically represent equal distances.
IBM’s measurement-level documentation distinguishes nominal, ordinal, and scale settings. Those settings describe how SPSS treats variables; the research instrument and design still determine whether that treatment makes substantive sense.
Check labels against the collected data. A variable labeled “age in years” should not contain birth years or age categories. If a measure changes across questionnaire versions, record the difference before combining observations.
For derived scores, document the contributing items, reverse-scoring rules, completion threshold, and possible range. Keep original items available so another reviewer can reconstruct the score.
IBM’s metadata guidance explains that Variable View supports labels, missing categories, measurement level, and other attributes. Review these definitions when importing external data rather than assuming the defaults describe your study.
Verify the import before changing the data
Preserve the received source file unchanged. Record its export date, worksheet, source system, and any selection criteria used before export. Create a working copy for preparation and analysis.
Compare row and column counts with the source. Inspect a few records containing dates, decimals, blanks, and long text. Check whether identifiers retained leading zeros and whether numeric fields imported as numbers rather than strings.
US and UK date conventions deserve particular attention. A value such as 04/07/2026 is ambiguous without its source convention. Do not infer the convention from the location of the analyst.
Review frequency tables and plausible ranges before calculating scores. A missing-response code of 99 can distort a mean if it remains a valid value. A spreadsheet’s formatting is not proof that SPSS imported the intended data type.
If preparation problems dominate the project, address them before interpreting models. The related guide to SPSS data cleaning services covers detailed checks and an auditable correction record.

Inspect filters, weights, and Split File before analysis
Correct records do not guarantee that SPSS is analyzing the intended sample. Active settings can alter which observations contribute and how output is organized. Record these settings when receiving an existing file and before rebuilding final results.
Filters are not the same as deleted records
IBM’s Select Cases documentation distinguishes filtering, copying selected records, and deleting unselected records. Filtering retains excluded records in the dataset. Deleting them and saving the file is not reversible by switching the filter off.
Inspect the eligibility condition and count the selected cases. Do not assume that a filter left from exploratory work belongs in the final analysis. Retain a written reason for every intended restriction.
Establish what a weight actually means
IBM’s WEIGHT reference describes simulated replication and distinguishes it from complex-sample weighting. WEIGHT can remain active until changed or disabled. Missing or nonpositive weight values exclude cases from statistical procedures.
Consequently, ask where a proposed weight came from and which procedure should use it. Frequency counts and sampling-design weights are not interchangeable. Complex survey analysis may require design-aware procedures rather than the ordinary WEIGHT command.
Confirm whether separate group output is intended
Split File can produce separate analyses for groups. That may be appropriate for a specified descriptive task, but it is not a substitute for testing a group difference. Check the grouping variables and whether the final brief requires pooled or separate output.
When any setting is intentional, document its purpose. When it is not, reset it explicitly in the analysis workflow. Save the final settings with the evidence needed to reproduce the reported sample.

Keep exploratory work separate from planned tests
Exploration helps you understand the data. Examine distributions, category counts, unusual observations, missingness, and relationships that matter to your study. This work can expose coding problems or challenge assumptions behind an initial plan.
NIST’s introduction to exploratory data analysis describes an approach that uses graphical and other techniques to uncover structure and investigate assumptions. Exploration is broader than producing attractive charts.
However, a pattern noticed after inspecting many outcomes is not equivalent to a prespecified hypothesis. Label newly generated questions as exploratory. Do not rewrite the original plan to make an unexpected result look predicted.
If exploration reveals a genuine problem, revise the analysis transparently. Explain the issue, the revised approach, and its implications. A justified change is different from quietly searching for a favorable p-value.
Keep a decision log with dates and reasons. This helps a supervisor distinguish planned analyses, necessary corrections, sensitivity checks, and new questions requiring further research.
Choose analyses from the design and outcome
Test selection starts with the question and study structure. Consider the outcome’s scale, independent or repeated observations, number of groups, relevant covariates, and intended inference. The same variable can play different roles in different models.
| Analytical question | Design information needed | Important distinction |
|---|---|---|
| Compare group outcomes | Outcome scale, group count, independence, and sample sizes | Independent groups differ from repeated measurements. |
| Describe an association | Variable meaning, distributions, and possible confounding | An association alone does not establish causation. |
| Model an outcome | Outcome type, predictors, sample structure, and model purpose | Explanation and prediction require different evaluation decisions. |
| Analyze questionnaire scores | Scoring rules, missing items, dimensionality, and instrument evidence | A reliability coefficient does not validate every use of a score. |
This table is a starting framework, not an automatic test selector. Several approaches may address a question under different assumptions. Ask the analyst to explain the chosen approach and the alternatives considered.
For method-specific detail, see ANOVA analysis help and regression analysis help. Questionnaire projects also need questionnaire data analysis guidance before interpreting derived scores.
Explain missing observations and model-specific samples
Distinguish ineligible records from missing values among eligible records. An unanswered outcome does not mean that the participant failed the recruitment criteria. These situations belong in different parts of the sample description.
Count missingness for each variable and for combinations needed by a model. A descriptive table may use more observations than a model requiring several predictors. Report the analyzed sample for each result rather than repeating the original recruitment total.
Discuss why values might be missing. Technical failure, a skipped question, withdrawal, and structural non-applicability have different meanings. A convenient deletion rule does not resolve the consequences of those differences.
Any imputation plan needs methodological justification and appropriate uncertainty handling. Do not fill blanks merely to produce a complete-looking spreadsheet. Preserve the original values and document the assumptions behind the chosen approach.
Finally, compare the reported denominators with the actual procedure output. Unexpected losses can come from missing predictors, active filters, or weight definitions. Investigate the cause before explaining the result.
Use an analysis register to connect questions and output
An analysis register assigns a short identifier to each planned result. For example, A01 might describe the sample, A02 compare the primary outcome, and A03 examine a specified adjusted association. Use those identifiers in syntax comments and output headings.
For each entry, record the dataset version, eligible sample, variables, settings, procedure, and reporting destination. Include the assumption checks and any linked sensitivity analyses. This creates a map between the brief and the final files.
A result without a clear question may be unnecessary. Conversely, a question without a linked output entry may have been overlooked. The register helps identify both problems before a long document reaches a supervisor.
Keep preliminary and final output separate. Mark superseded analyses instead of leaving several conflicting tables with equally plausible names. If an analysis changes, update the register and explain the reason.
This approach makes SPSS data analysis help useful beyond a single consultation. Another reader can locate the evidence behind a statement without guessing which output file was current.
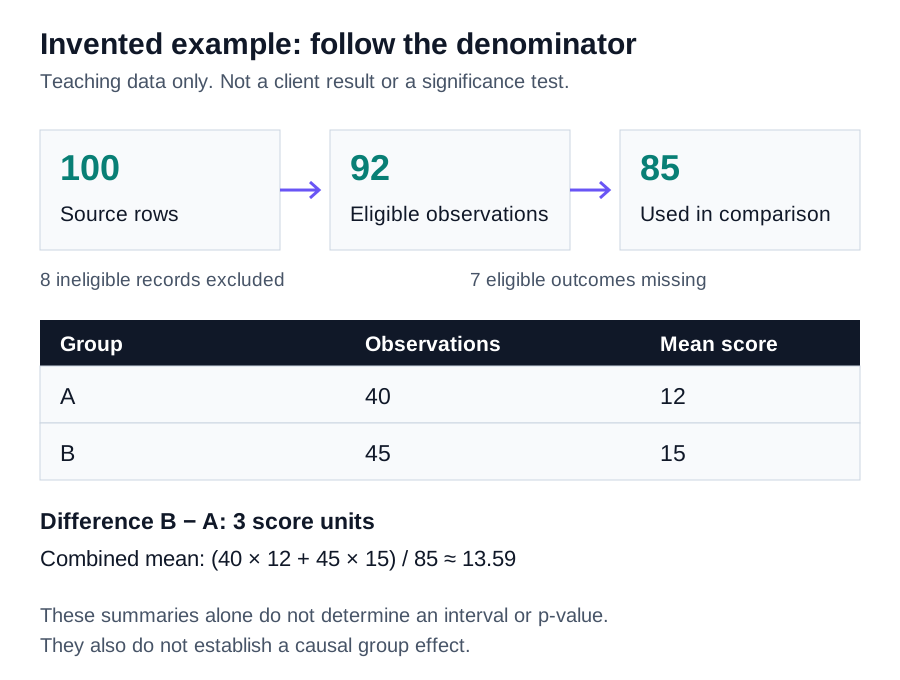
Invented example: trace 100 source rows to 85 observations
Imagine an independently sampled teaching dataset containing 100 source rows. Eight records fail a prespecified eligibility rule, leaving 92 eligible observations. Seven eligible observations lack the outcome required for one descriptive comparison, leaving 85 usable observations for that comparison.
Suppose those 85 observations contain two independent groups. Group A has 40 observations with a mean score of 12. Group B has 45 observations with a mean score of 15. The unadjusted difference, B minus A, is three score units.
The combined mean is not the simple average of 12 and 15. Accounting for group sizes gives (40 × 12 + 45 × 15) / 85, approximately 13.59. This arithmetic illustrates why group counts must accompany summaries.
No standard deviations, sampling model, or raw observations are supplied here. Therefore, this example does not justify a confidence interval, significance test, or causal conclusion. Those cannot be reconstructed from the two means alone.
The sample flow should remain visible in the report. Describe 100 source rows, 92 eligible observations, and 85 observations used for this comparison. A later model could use a different number if it requires additional variables.
Save syntax that rebuilds the reported findings
Keep preparation and analysis commands in an ordered syntax workflow. Start with the preserved source, apply documented transformations, establish intended settings, and run the registered analyses. Include meaningful comments explaining decisions, not just procedure names.
Use clear section labels that match the analysis register. Record required software versions and optional modules. Avoid relying on an unsaved menu choice from an earlier session.
A reproducibility check should begin from a fresh session and the identified source file. Compare case counts, important descriptive values, model coefficients, and warnings with the delivered output. Investigate differences instead of assuming they reflect harmless rounding.
If a procedure involves randomness, document the relevant settings and seed where supported. If manual review affects the final sample, preserve an authorized, de-identified decision record that the workflow can apply consistently.
Syntax does not make every analytical decision correct. It makes those decisions inspectable and repeatable, which is essential for an informed review.
Interpret the findings without overstating them
Begin an interpretation with the question answered and the sample analyzed. Explain the direction, magnitude, units, uncertainty, and relevant limitations. A software table should support the statement rather than replace it.
Keep adjusted and unadjusted results distinct. A coefficient from a model containing specified covariates has a different interpretation from a simple group mean difference. Identify the reference category and scale of the outcome.
A non-significant result does not automatically demonstrate that two conditions are equivalent. Similarly, a small p-value does not establish practical importance. Consider the estimate, uncertainty, design, and context together.
Explain what the data cannot show. An observational association may have alternative explanations. A convenience sample may not represent every student or institution. State those limitations beside the relevant finding.
The guide to SPSS results interpretation help focuses on turning output into careful explanations without inventing evidence.
Agree on the deliverables before the handoff
A handoff should contain more than a polished document. Specify which files will be supplied and how each connects to the agreed scope. Check that the files remain usable with your software and institutional requirements.
- The identified analysis dataset, with a documented version and variable definitions.
- Preparation and analysis syntax linked to the analysis register.
- Relevant SPSS output, including warnings and assumption checks.
- Editable tables or figures with meaningful titles, units, and denominators.
- A decision log explaining exclusions, transformations, and unresolved questions.
- An interpretation note distinguishing supported conclusions from limitations.
Agree how clarification requests will be handled. A question about an existing table differs from a new research question or an additional dataset. Confirm revised scope before assuming that further analysis is included.
For dissertation reporting, the related Chapter 4 dissertation help guide explains how to organize results without confusing them with the discussion chapter.
Review the package against a short acceptance checklist
Check every research question against the delivered analysis register. Confirm that the intended outcomes, categories, and comparison directions appear. Verify that the final sample counts reconcile with the documented exclusions and missingness.
Next, compare the report with the actual output. Check signs, decimal places, reference groups, table labels, and units. A correct model can still be misreported through a copied value or an unexplained coding convention.
Open the supplied files and test the instructions. Confirm that relative file paths, required modules, and data versions are understandable. Identify any step requiring access that the student does not have.
Lastly, list unresolved issues explicitly. A missing instrument-scoring rule or an uncertain recruitment detail should remain visible. A complete-looking handoff must not conceal limitations that affect the analysis.
Use SPSS data analysis help within university rules
Students in the USA and UK should check their institution’s rules on statistical consultation, tutoring, editing, data sharing, and disclosure. Permission can depend on the assessment and the type of external contribution.
You remain responsible for your research question, ethical approvals, academic decisions, and submitted work. Consultation should support understanding and permitted analysis, not provide a dissertation to misrepresent as independently completed.
Share only data you are authorized to disclose. Remove direct identifiers and review indirect combinations that could reveal participants. De-identification requires more than deleting a name column.
Do not upload sensitive records simply because an order form accepts files. Confirm an appropriate sharing arrangement first. Provide a synthetic illustration when access restrictions prevent sharing the real dataset.
Frequently asked questions about SPSS data analysis help
Can I request help with output I already have?
Yes, but include the question, variable definitions, sample restrictions, and syntax if available. Output alone may not reveal an active filter or an unexpected coding decision. Explain which table or interpretation is causing difficulty.
Do I need an SPSS file to begin a consultation?
Not necessarily. A documented spreadsheet or CSV can support an initial scope discussion. Include the source conventions, codebook, and study design. Importing a file successfully does not establish that its structure is suitable for analysis.
Why does my model use fewer cases than my dataset?
Possible reasons include missing model variables, eligibility restrictions, active filters, and weight definitions. Check the procedure’s case-processing information and your saved settings. Do not choose a remedy until you understand the loss.
Can one test answer all my hypotheses?
Sometimes a coherent model addresses several planned questions. However, different outcomes or observation structures can require different approaches. Describe the hypotheses together so the analysis plan considers their relationship and any multiplicity concerns.
Should I select the method that gives significance?
No. Choose an approach that fits the question, design, and assumptions. Report justified changes and relevant sensitivity checks. Searching across methods and reporting only a favorable result hides important uncertainty.
What should I ask before requesting a quote?
Ask about scope, required files, deliverables, applicable software, review arrangements, and data-sharing requirements. Provide your deadline for assessment rather than assuming availability. Check the pricing information and confirm the project-specific scope.
Prepare a clear request for statistical consultation
To request SPSS data analysis help, gather your research questions, de-identified data, codebook, existing syntax, and relevant output. Add the approved methods plan, reporting instructions, and a concise list of decisions requiring review.
Use the statistical services directory to identify the relevant area, or send your project requirements for a scope discussion. A useful request makes the analytical problem clear without promising a particular result before the data and design have been reviewed.