

SPSS questionnaire analysis help should connect your survey questions to defensible research conclusions. A spreadsheet of responses is only the beginning. You still need to establish what each variable measures, which respondents belong in the analysis, how scores are constructed, and what the results can reasonably say about your target population.
This guide explains that process for students preparing US dissertations, master’s theses, and research projects. It also applies to UK dissertations, where supervisors may use different chapter labels or reporting conventions. Your approved proposal, instrument instructions, ethics requirements, and departmental guidance take priority over a generic checklist.
The aim is not to find a statistically significant result. It is to build an analysis you understand and can reproduce. The examples below are invented teaching examples, not findings from students or clients. Consultation can support your decisions and interpretation, but you remain responsible for your research and any required disclosure of assistance.
Start with the questionnaire, not the statistics menu
Before opening SPSS, make a research-question map. For each question, identify the outcome, explanatory variables, population, and intended comparison. A question about the distribution of student confidence requires different evidence from a question about whether confidence changes after a workshop.
Write the proposed answer in ordinary language. For example: “We will estimate the average confidence score among respondents and examine its association with reported study hours.” That sentence identifies two tasks. It does not yet justify a causal claim, a particular regression model, or combining every questionnaire item into one score.
Next, check whether the instrument actually captures those concepts. An item about satisfaction with library opening hours does not directly measure academic performance. If the approved questionnaire does not measure a required construct, additional statistical procedures cannot repair that gap.
For questions still being developed, AAPOR’s survey best practices provide a useful starting point on clear question wording and questionnaire design. Discuss revisions with your supervisor before collecting new responses.
Build a codebook that another researcher could follow
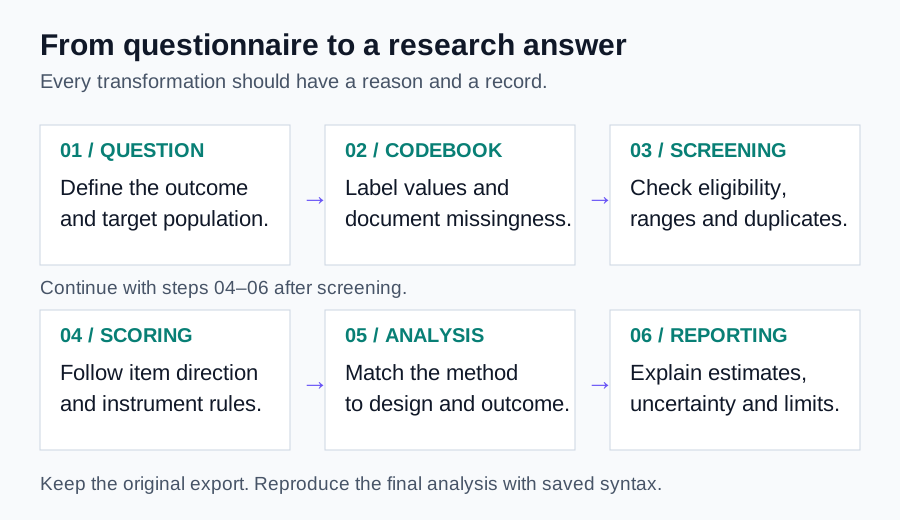
A codebook is the agreement between your questionnaire and your data file. Record each variable name, full question, response labels, permissible values, measurement level, and missing-value codes. Add the survey version and any routing rules. This prevents later confusion about what a number represents.
For example, support_q3 might contain responses from 1, strongly disagree, to 5, strongly agree. A separate value of 99 could mean that the respondent skipped the item. Without labels and a missing-value definition, SPSS may treat 99 as a genuine high score.
Do not treat participant identifiers as measured quantities. An identifier of 1048 is not “more” of a characteristic than an identifier of 1047. Similarly, a numerical code for a department is categorical. Assigning numbers to categories makes storage convenient; it does not create meaningful distances between categories.
Include a short note for every derived variable. State which items contribute, whether any are reversed, how missing items are handled, and the possible score range. That note becomes especially valuable when a committee requests changes several months after the original analysis.
Check the unit of analysis and duplicate responses
Establish what one row represents. It might be one respondent, one visit, or one response at one time point. Repeated observations from the same person cannot automatically be treated as independent participants. Keep a participant identifier and time variable if your design includes repeated measurement.
Potential duplicates deserve investigation, not immediate deletion. Two similar records could represent repeated submission, legitimate follow-up responses, or different people with identical answers. Use the collection platform’s permitted identifiers, timestamps, and your prespecified rules to make the distinction.
Create an inclusion flag instead of destroying records. Record the reason for each exclusion in a separate decision log. Then report both the number of submitted responses and the number analyzed. A reader should be able to reconcile those numbers without guessing which cases disappeared.
If these issues dominate your project, use the more detailed SPSS data cleaning services guide before moving to scale construction.
Reverse scoring must follow the instrument instructions
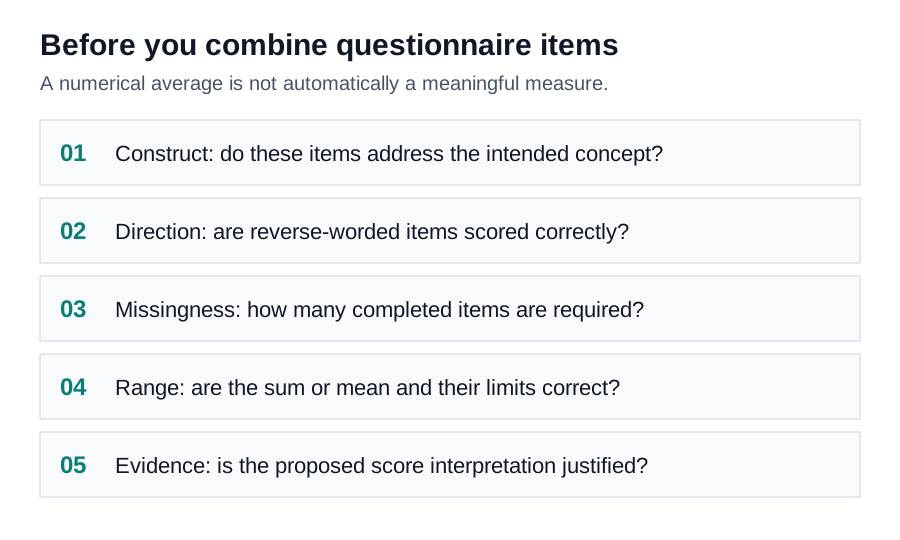
Some questionnaires include items pointing in opposite directions. A positively framed item may score high for confidence, while a negatively framed item scores high for uncertainty. Those items need a common direction before you combine them, provided the instrument’s scoring instructions require it.
For a genuine 1–5 item, reversing valid responses uses 6 minus the original value. Thus, 1 becomes 5, 2 becomes 4, and 3 remains 3. A missing-response code must not pass through that calculation as if it were a valid answer.
Create a new variable and retain the original. Check a frequency table before and after recoding. Confirm that the new range remains 1–5 and that missing observations stay missing. IBM’s RECODE documentation describes the relevant command behavior; use the documentation matching your installed version.
Do not reverse an item simply because doing so increases reliability. Direction comes from the meaning and scoring specification of the measure, not from whichever coding produces a preferred coefficient.
Distinguish unanswered questions from meaningful responses
A blank response, “not applicable,” and “prefer not to answer” are not necessarily the same event. Someone outside a questionnaire’s eligibility branch may have a structurally absent answer. Another respondent may have skipped a sensitive question. Combining those cases can hide an important feature of your data.
Summarize missingness by item and respondent. Check whether missing answers cluster in a particular questionnaire section or respondent group. An item placed after a long block may have more missing responses because participants stopped early. That is different from a single misunderstood question.
Agree on the minimum information required to compute a scale. Follow the published scoring rules where they exist. If you create a new rule, explain it and examine how conclusions change under a reasonable alternative. Do not replace every blank with the overall mean merely to keep the sample size unchanged.
More complex missing-data methods require assumptions and an appropriate analysis plan. Their purpose is not to fabricate observed answers. Keep a clear distinction between recorded responses, derived scores, and any imputed values.
Describe individual items before constructing a scale
Frequency tables reveal whether response categories were used as expected. Look for impossible codes, unexpectedly empty categories, and strong floor or ceiling patterns. A bar chart can show an item’s distribution more clearly than a long list of percentages in the text.
Use a clear denominator. “Forty percent agreed” is incomplete if readers cannot tell whether the percentage uses all respondents or only those answering the item. State the valid sample size, and keep response ordering consistent across tables and charts.
A single Likert-type item is ordered categorical information. A multi-item score may support different analytical choices when its construction and measurement properties justify them. Neither labeling a variable “scale” in SPSS nor averaging items automatically establishes that justification.
Also examine unusually repetitive patterns without assuming misconduct. A respondent may genuinely choose the same category repeatedly. Attention-check exclusions and minimum completion times should come from a documented rationale, preferably established before looking at outcomes, rather than from an effort to improve results.
What reliability analysis can and cannot establish
Internal-consistency analysis examines how items behave together in your sample. It can identify an item whose coding or content needs investigation. It cannot, by itself, prove that the questionnaire measures the intended construct, has one dimension, or will work equally well in another population.
Run reliability analysis separately for conceptually distinct subscales. A questionnaire covering confidence, financial stress, and social support does not necessarily have one meaningful overall reliability coefficient. Combining unrelated domains can create an unhelpful total even when a numerical coefficient looks impressive.
Review the item wording, inter-item relationships, corrected item-total statistics, and the instrument’s prior evidence. An unusual coefficient may reflect incorrect reverse coding, restricted responses, heterogeneous content, or a small and unstable sample. Investigate those possibilities before deleting items.
IBM’s reliability analysis walkthrough identifies the relevant SPSS procedure. Depending on your release and options, available reliability models differ. Choose and explain the estimator rather than reporting every available coefficient without a measurement rationale.
A high coefficient is not a reason to claim that the instrument is “fully validated.” It is one piece of evidence about a particular score in a particular set of responses.
Validity requires a broader measurement argument
Ask what evidence connects the score to its intended interpretation. Content evidence concerns whether the items cover the concept. Structural evidence concerns whether relationships among items fit the proposed dimensions. Relationships with other variables may support or challenge expectations about the measure.
Exploratory factor analysis and confirmatory factor analysis answer different questions. Exploration can investigate a plausible structure when it is not established. Confirmation evaluates a specified model. Running both on the same small dataset and presenting the final model as independently confirmed overstates the evidence.
Sample adequacy is not resolved by a universal respondents-per-item rule. Item distributions, number of factors, loading strength, model complexity, and estimation method all matter. Discuss feasibility before adding factor analysis simply because it appears in another dissertation.
Published instruments also require attention to permissions, adaptation, and scoring. Changing wording, response options, language, or population can affect interpretation. Record those changes rather than presenting the adapted version as identical to the original instrument.
Select tests from the question and study design
A questionnaire can produce categorical responses, ordered items, counts, and defensible composite scores. Therefore, “survey data” is not enough information to select a statistical test. Start with the outcome and whether observations are independent, paired, repeated, or clustered.
A categorical association may call for a contingency-table analysis. A comparison of an appropriate quantitative score between independent groups may call for a mean comparison. Associations involving several predictors may require a regression model with an outcome distribution suited to the data.
Check the relevant assumptions for the proposed analysis. Do not use one normality-test result as a universal switch between “parametric” and “nonparametric” methods. Consider the model, group sizes, outliers, residual behavior, and the scientific quantity you want to estimate.
For further detail, see SPSS hypothesis testing help, ANOVA analysis help, and regression analysis help. These related guides address different questions rather than offering interchangeable ways to search for small p values.
A practical SPSS questionnaire analysis workflow
Import and verify the data
Keep the untouched export in a separate read-only folder. Import a working copy, then compare the number of rows and columns with the original export. Verify a few records against the source, especially dates, identifiers, decimal separators, and multiple-choice questions exported into several columns.
Document transformations
Set variable labels, value labels, and missing values. Create inclusion flags, reversed items, and composite scores with syntax wherever practical. Use descriptive names such as confidence_mean, not unexplained labels such as newvar7. Paste commands from dialogs and annotate the decisions.
Run checks before final models
Inspect item distributions, score ranges, missingness, and the measurement evidence required by your plan. Then run the prespecified descriptive and inferential analyses. Menu names, module availability, and output layouts vary between SPSS versions, so record the version and confirm procedure options in the matching documentation.
Rebuild the final output
Run your final syntax from the original working import. Confirm that it reproduces the clean dataset and reported results without relying on unsaved manual edits. Save output with a version date and retain a short record of decisions changed after supervisor feedback.
Invented example: constructing a confidence score
Suppose a teaching dataset contains five confidence items, each scored from 1 to 5. Four items point toward greater confidence. The third asks about feeling unable to complete a research task and therefore points in the opposite direction. Assume the scoring plan requires that item to be reversed.
One invented respondent answers 4, 3, 2, 5, and 4. Reversing the third answer changes 2 to 4. The scored values are now 4, 3, 4, 5, and 4. Their sum is 20, and their mean is 4.0. Both scores carry the same ordering here, but they have different ranges and must be labeled correctly.
If another respondent leaves two items unanswered, you cannot automatically apply the same calculation. The permitted minimum number of completed items should come from the instrument or the documented scoring plan. Different missing-item rules can produce different analyzed samples.
This calculation illustrates scoring only. It does not show reliability, validity, population representativeness, or evidence that an intervention caused higher confidence. Those conclusions require additional information and analysis.

Interpret estimates, uncertainty, and practical importance
A result should answer the research question, not merely name a procedure. Explain the direction and size of an association or difference in the original units where possible. Add an appropriate effect-size measure when it helps readers compare or understand the finding.
Report confidence intervals and describe what their width means for precision. A narrow interval around a small effect tells a different story from a wide interval spanning effects in both directions. The latter may leave an important research question unresolved even when an estimate appears promising.
Cross-sectional questionnaire associations do not establish which variable came first. Higher support scores might accompany greater confidence, but confidence could influence perceptions of support. Other variables or selection processes could affect both. Statistical adjustment alone does not settle those possibilities.
Explain limitations in terms of consequences. Instead of writing only “the sample was small,” say which estimates were imprecise or which subgroup comparisons could not be investigated reliably. That gives readers a clearer account of what remains uncertain.
Report the sampling process honestly
Describe who could participate, how invitations were distributed, and who actually responded. A university mailing list, an online student group, and a probability-based sample have different implications. The largest available sample is not automatically representative of US students or UK students.
Weighting also needs a rationale, reliable comparison information, and appropriate variance estimation. It cannot guarantee that unobserved differences between respondents and nonrespondents have disappeared. If your design involves clusters, strata, or survey weights, ordinary unweighted procedures may not provide suitable uncertainty estimates.
AAPOR’s disclosure standards are a useful reference for describing recruitment, sample design, question wording, and weighting. Follow your institution’s requirements and disclose enough detail for readers to evaluate the evidence.
Prepare tables that support a results chapter
Organize the chapter around research questions rather than the order of tables in the SPSS output viewer. Begin with the analyzed sample, then describe relevant variables, measurement checks, and the planned tests. Put lengthy diagnostic output in an appendix when your department permits it.
Use informative titles and notes. A reader should understand the score direction, response range, sample size, abbreviations, and missing-data treatment without searching through several chapters. Avoid copying every software table when only a few rows answer the question.
For US programs using APA conventions, consult the current departmental handbook alongside APA’s Journal Article Reporting Standards. UK institutions may require a different presentation style, but transparent descriptions of methods and results remain important.
What to send when requesting questionnaire analysis support
Prepare your approved research questions, hypothesis list, questionnaire, scoring instructions, and anonymized dataset. Include the codebook, collection method, inclusion criteria, and any supervisor comments. Explain which parts of the analysis have already been completed and which decisions remain open.
Remove names, email addresses, direct identifiers, and unnecessary sensitive information before sharing. Check your consent materials and institutional rules first. A coded identifier is not automatically anonymous when a linking key or a combination of characteristics can identify someone.
Ask for a defined scope: data checking, scoring review, test selection, syntax, output interpretation, or feedback on your own results presentation. Agree on required files and permitted assistance. A reproducible explanation is more useful than an unexplained table that you cannot defend.
Frequently asked questions
Can I analyze a questionnaire with a small sample?
Often you can describe the responses, but the precision and feasibility of more complex analyses may be limited. Begin with the intended estimates and model complexity. Report uncertainty and avoid unsupported subgroup claims. A small dataset should not be expanded by duplicating cases or inventing responses.
Should I remove an item to increase Cronbach’s alpha?
Not automatically. Check coding, wording, content coverage, and the original scoring instructions. Removing an item changes the measure and may narrow the construct. If a revision is defensible, document the reason and distinguish exploratory changes from the original plan.
Can every survey question become a hypothesis?
No. Some items describe the sample or provide context. Testing every possible association creates a large and often poorly motivated analysis. Prioritize the approved research questions, distinguish primary from exploratory analyses, and address multiplicity where appropriate.
Can consultation replace my supervisor’s approval?
No. Your supervisor, committee, or institutional review process remains responsible for academic and ethics decisions. Statistical support can clarify options and limitations. It cannot approve a changed design, authorize restricted data sharing, or guarantee acceptance of your dissertation.
Plan the next step
If your questionnaire is ready but the analysis is unclear, identify the decision that needs attention first. It may be scoring, missingness, measurement evidence, or a specific comparison. Addressing that decision early reduces repeated work later.
Review the pricing information, then submit an analysis-support brief with anonymized files and your research questions. For the wider dissertation workflow, read the SPSS dissertation help guide. Request support that leaves you able to explain the method, results, and limitations in your own work.