

Chapter 4 dissertation help should make the path from your research questions to your reported findings easy to follow. A results chapter is not a folder of SPSS screenshots. It is a structured account of the analyzed sample, measurement decisions, statistical evidence, and limits of that evidence. A reader should understand what each result answers without guessing which hypothesis or dataset produced it.
This guide focuses on organizing and checking a quantitative results chapter. It is primarily for students at US universities and also addresses UK dissertation and thesis conventions. Chapter numbering varies across programs. Your department’s current handbook and your supervisor’s approved structure take priority over a generic five-chapter outline. The objective is transparent reporting, not a promise of significant results.
What Chapter 4 dissertation help should include
A useful review identifies gaps between your approved methods and the evidence you report. It checks whether every research question has a corresponding analysis, whether sample sizes agree, and whether tables say what your prose claims. It also separates problems in writing from problems in analysis. Editing a sentence cannot repair a wrongly coded outcome or an unsupported statistical model.
Prepare a short chapter brief before requesting support. State your research questions, design, analysis stage, software version, and submission requirements. Explain whether you need a structure review, an output audit, table guidance, or help understanding a particular result. Those are different tasks, with different file requirements and time commitments.
For analysis planning rather than chapter organization, begin with SPSS dissertation help. If you already have output but cannot explain its estimates, our separate guide to SPSS results interpretation help addresses that reading process.
Confirm your university’s chapter conventions first
Some programs separate results from discussion. Others allow a combined chapter, a manuscript format, or several results chapters. Ask where your committee expects interpretation, limitations, and links to earlier literature. A small explanatory sentence may be appropriate in a results chapter even when the broader discussion belongs elsewhere. The distinction is functional, not a ban on explaining what a number means.
Cornell’s dissertation guidance allows chapter headings consistent with the academic field. This illustrates why one university’s layout should not be presented as a universal rule.
Keep a requirements sheet with heading levels, table numbering, spelling convention, reference style, and the approved terminology for participants. US and UK programs can differ, but neither country has a single compulsory dissertation format. Check the actual institutional instructions instead of assuming that a national label settles every detail.
Create a research-question reporting map
Build a working matrix with one row for each research question. Record the outcome, predictors or groups, planned method, analyzed sample, main table, supporting figure, and subsection heading. Add the syntax file and output location. The matrix is a quality-control tool; it need not appear in the submitted chapter unless your program finds it useful.
For example, a question about differences between two independent groups needs a clearly identified comparison. A question about predictors of an outcome needs a specified model and adjustment set. A question about change over time needs a method that recognizes repeated observations. Merely assigning each question a p-value does not establish that these distinct designs were handled correctly.
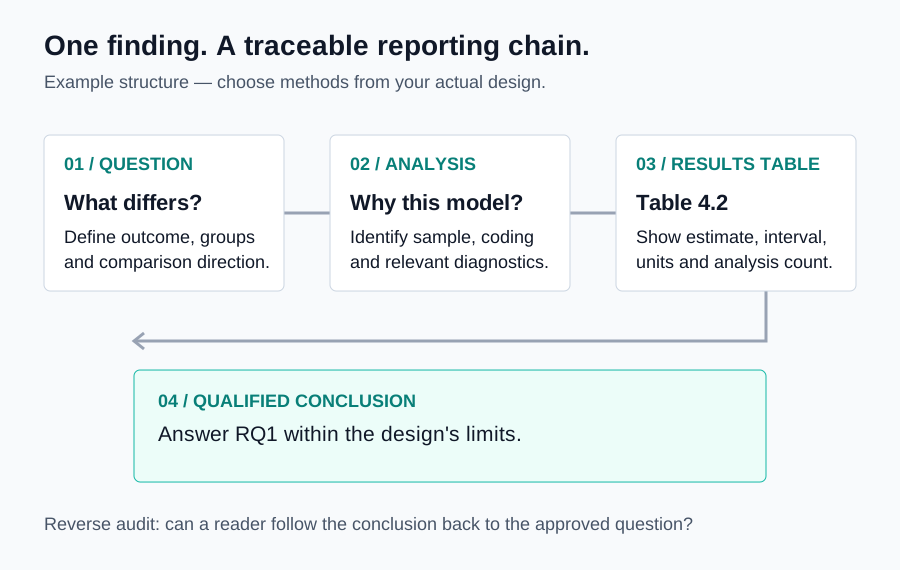
Use the same question identifiers in your methods, working matrix, results headings, and review notes. If the approved question changes, record why and when. That cross-chapter traceability prevents a common problem: the introduction promises one study while the results quietly report another.
Begin with the analysis sample, not the most interesting test
Describe how the dataset became the sample used for analysis. Report relevant stages such as invitations, responses, eligibility checks, usable records, and model-specific exclusions. These counts answer different questions. A survey response rate requires a defensible invitation denominator; an analysis completion rate concerns the records retained after processing.
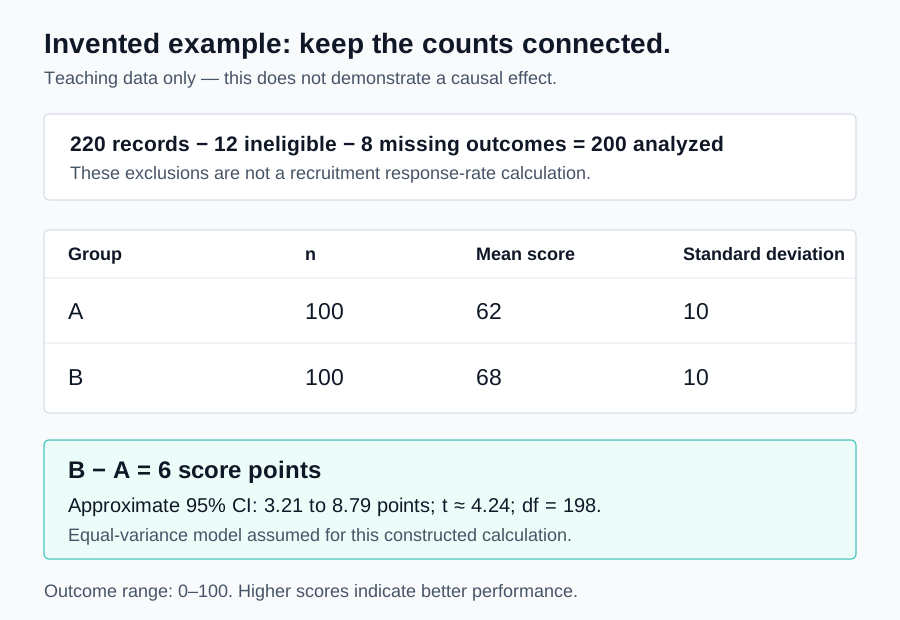
In an invented example, 220 survey records arrive. Twelve respondents do not meet eligibility rules, leaving 208. Eight additional records lack the primary outcome, leaving 200 for that analysis. Do not describe all 20 records as missing outcomes. Also, do not call 200 divided by 220 a recruitment response rate without knowing who was invited.
The STROBE observational-study checklist requests participant counts at relevant stages, missing-data information, and estimates with precision. Use its design-specific prompts where applicable; it is a reporting aid, not proof of methodological quality.
Make variable definitions consistent across chapters
List the outcome’s units, possible range, scoring direction, and construction. A total score and an average item score may measure the same construct but have different numerical scales. Explain whether higher scores represent a favorable or unfavorable outcome. A table labelled only “performance” leaves too much of the analysis undefined.
Check that variable names in your codebook correspond to readable labels in the dissertation. Use one term for each construct throughout the chapter. If “academic confidence,” “self-efficacy,” and “confidence score” all refer to the same measure, explain the connection and choose a consistent main label. If they are different constructs, do not merge them for stylistic variety.
Measurement decisions belong in the methods, but their consequences must be visible in results. Report the scoring and reliability information needed to understand the analyzed measures. Refer readers to SPSS questionnaire analysis help when the unresolved problem is scale construction rather than chapter layout.
Present descriptive results before model-based findings
Describe the characteristics needed to understand the research sample and its measurements. Select summaries according to the variable and question. Counts and clearly defined percentages suit categorical information. Quantitative measures often need a central summary, spread, range, and valid sample size. Choose summaries that reveal the data rather than making every row look identical.
Do not list every demographic variable simply because it exists. Include information relevant to recruitment, interpretation, comparability, or the approved reporting requirements. In small samples, combinations of characteristics can reveal identities. Review disclosure risk before presenting detailed subgroups, especially in educational, clinical, or workplace research.
State how denominators work in each table. If percentages exclude missing responses, label them as valid-response percentages. If respondents could select several options, explain why percentages may exceed 100% when added. These notes are not cosmetic; they prevent a reader from inferring a population distribution that the table does not show.
Give diagnostics an appropriate place
A short diagnostics subsection can explain the evidence behind a modeling decision. Include relevant findings about data quality, residuals, variance, influential cases, dependence, or measurement structure. Avoid treating a collection of nonsignificant assumption tests as a certificate that the analysis is correct. Some conditions, such as independence, depend heavily on study design.
Report consequential decisions clearly. If unequal variability led to a different comparison method, identify that method and its rationale. If a sensitivity analysis examined an influential record, report whether the substantive conclusion changed. Do not remove a record only because its exclusion makes the main hypothesis significant.
Keep detailed diagnostic plots and extended checks in an appendix when that improves readability. The chapter should still explain the decision they informed and direct readers to the relevant appendix. A hidden diagnostic file that cannot be linked to the reported model provides little transparency.
Use a repeatable structure for each research question
Start the subsection by naming the question in plain language. Briefly identify the variables and model. Present the main estimate, uncertainty, and supporting statistical evidence. Refer to the appropriate table or figure, then explain the narrow conclusion that the design supports. Use this same sequence across questions so readers can compare findings without relearning the chapter’s organization.
A consistent structure does not require repetitive wording. A group difference, a correlation, and an odds ratio have different meanings. Their subsections should share a logical sequence while retaining the language each estimate requires. Avoid replacing the substantive question with a list of software procedure names.
Distinguish prespecified analyses from exploratory follow-ups. Both can be informative, but they should not be presented as if they had the same status in the original plan. Place additional analyses in a clearly labelled subsection and explain what prompted them. This remains important when their findings are interesting or statistically inconclusive.
An invented reporting example with consistent counts
Suppose the invented dataset above contains 100 eligible students in each of two independent study groups after outcome exclusions. Group A has a mean assessment score of 62 and a standard deviation of 10. Group B has a mean of 68 and a standard deviation of 10. The score ranges from zero to 100, and higher values indicate better performance.
For a conventional equal-variance comparison, the estimated difference, B minus A, is six points. Its standard error is the square root of 100 divided by 100 plus 100 divided by 100, or approximately 1.414. With 198 degrees of freedom, an approximate 95% confidence interval is 3.21 to 8.79 points. The corresponding t statistic is about 4.24.
These are constructed teaching values, not findings from a client or university study. They demonstrate an internally consistent reporting chain. Whether an equal-variance analysis is justified would require the actual design and diagnostic information. A complete results chapter cannot be reconstructed from these summary statistics alone.
Translate the example into a results paragraph
A suitable teaching paragraph could state that Group B’s mean score was six points higher than Group A’s, with a 95% confidence interval from 3.21 to 8.79 points. It could then report the relevant test statistic, degrees of freedom, and p-value according to the required style. Mention that the comparison includes 200 students, with 100 in each group.
Do not write that Group B’s approach caused the higher scores unless the study design supports a causal interpretation. These summary numbers do not tell us whether students were randomly assigned or whether the groups differed before the assessment. A carefully formatted paragraph can still overstate what the study establishes.
In the associated table, show both group means and standard deviations, the difference direction, and the confidence interval. The narrative should highlight the answer, not repeat every cell. A short cross-reference can direct readers to further detail without forcing them to interpret an unexplained output screenshot.
Design tables that remain understandable on their own
Give every table a descriptive title and define abbreviations, units, reference categories, and special symbols. State whether a column contains standard deviations, standard errors, or confidence limits. Those quantities serve different purposes. Keep rounding consistent while retaining enough precision to distinguish values that matter to the interpretation.
W3C’s accessible-table guidance explains the importance of identifying headers and their relationships to data cells. For web articles, use real table structure rather than an image. For dissertation documents, check that table accessibility survives export.
Read the table without looking at the surrounding paragraph. Can you identify the outcome, participants, model, and comparison? If not, revise the title or notes. A compact table is useful only when its compression does not remove the information needed to understand the result.
Export SPSS output without losing essential notes
Retain the original output file as an audit record, then build selected publication-ready tables from verified values. Check labels, decimal places, footnotes, and missing entries after export. Changing the layout is acceptable; changing a reported estimate to make the table appear more coherent is not. Rerun the analysis if the underlying result is wrong.
IBM’s OUTPUT EXPORT text documentation describes tabular export, caption and footnote settings, and separate graphics files. Check the exported document rather than assuming every explanatory note transferred automatically.
Save a source-location note for each final table. Record the syntax version, output section, and date of the verified analysis. If the dataset changes, update all affected tables and paragraphs together. A single corrected model can alter sample sizes, descriptive summaries, coefficients, and later discussion statements.
Report inconclusive and unexpected findings honestly
A result that does not cross a chosen significance threshold is still a result. Describe its estimate and uncertainty. An interval compatible with both a practically important difference and little difference indicates limited precision. That is different from compelling evidence that two approaches are practically equivalent.
Do not rewrite a hypothesis after seeing the output and present it as the original prediction. You can discuss an unexpected pattern and propose a future explanation, while clearly identifying the observation as exploratory. Keep contrary findings visible when they address an approved research question.
When several outcomes or comparisons were examined, explain the analysis family and any multiplicity approach. If no adjustment was planned, say how that affects interpretation. A chapter that reports only favorable comparisons gives the reader an incomplete picture of the evidence-generating process.
Check the boundary between results and discussion
Results usually establish what was observed under the stated analysis. Discussion considers why those observations matter, how they compare with earlier research, and what they imply within the study’s limitations. Follow your program’s structure, especially when it combines these functions. The main requirement is to distinguish evidence from explanation.
A sentence explaining that an odds ratio concerns odds rather than probability clarifies a result. A paragraph arguing that a policy should change involves a broader inference. Identify the additional assumptions needed for that inference instead of hiding them behind a statistically significant table.
Before moving to the discussion, summarize the findings by research question. Do not introduce a new model in the chapter summary. Ensure the summary’s language agrees with the main estimates, uncertainty, and stated design. This is where overly strong words such as “proves” often slip into an otherwise careful report.
Prepare a final cross-chapter audit
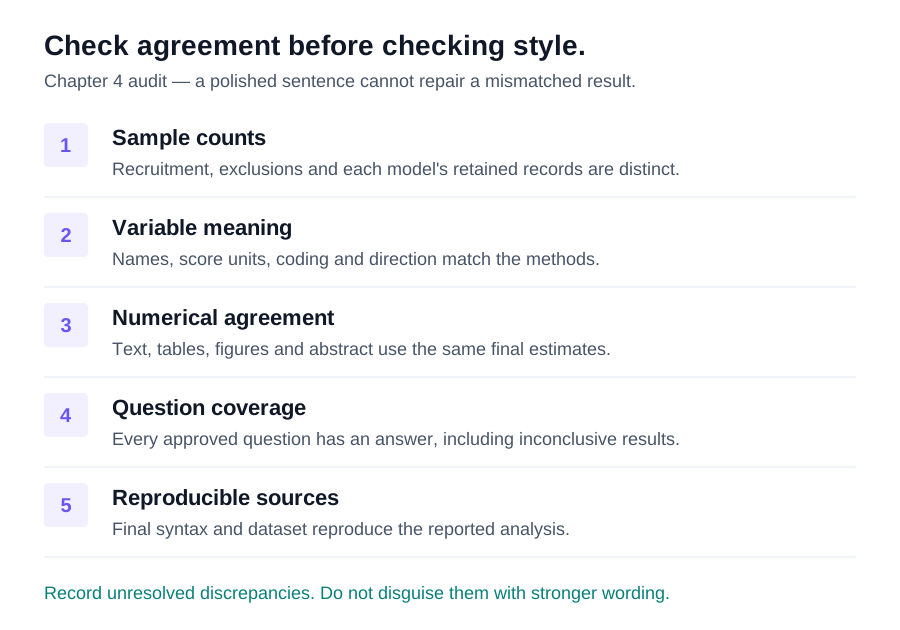
Compare the introduction, methods, results, abstract, and discussion using the reporting map. Check variable names, eligibility rules, analysis counts, model terms, and hypothesis labels. Confirm that the abstract reports the final analysis rather than an earlier output version. Verify that each table and figure is cited in the text and appears in the appropriate list.
Then inspect the working files. The final syntax should reproduce the tables from the final analysis dataset. Keep exclusions and transformations documented, not only remembered. If you inherited an analysis from another collaborator, identify the decisions you have verified and the unresolved assumptions requiring clarification.
Ask a reviewer to trace one important claim backward from the conclusion to its result, model, variables, and research question. If that route fails, the problem may be a missing explanation or a deeper inconsistency. This reverse audit is often more revealing than proofreading the chapter from beginning to end.
Manage supervisor revisions without losing the audit trail
Maintain a response log for methodological feedback. Record the comment, your proposed action, the affected analysis, and the location of the revised text. Separate requests for clearer explanation from requests that change the model. This distinction helps you avoid rerunning a sound analysis when the actual issue is an unclear table note.
If a revision changes the analysis, preserve the earlier version and document the reason. Update connected material together, including figure captions, summary statements, and discussion claims. A revised coefficient paired with an old confidence interval creates an internally inconsistent report even when both numbers came from genuine software output.
Before sending the chapter back, check each response against the current document rather than relying on tracked changes alone. Mark unresolved questions explicitly. An honest explanation of what still needs a committee decision is more useful than wording that makes a methodological disagreement appear settled.
Frequently asked questions about Chapter 4
How long should the results chapter be?
There is no useful universal word target. The chapter should cover the approved questions, relevant diagnostics, and necessary supporting detail without repeating every software table. Your program may impose a limit. Let the evidence and requirements determine the length rather than padding the chapter to resemble another dissertation.
Can I get help without handing over identifiable data?
A structure review may use a redacted chapter and anonymized tables. An analysis audit often needs a suitable dataset, syntax, and codebook. Discuss de-identification and permitted sharing before transferring files. Removing names alone may not protect participants when records contain rare combinations of identifying characteristics.
Can you write the chapter for me to submit?
Our support is for permitted statistical consulting, explanation, feedback, and transparent reporting guidance. You remain responsible for your dissertation’s authorship, decisions, and academic claims. Check your institution’s rules and disclose assistance where required. We do not offer a substitute for understanding or defending your own research.
What should I send for a chapter review?
Send the current chapter, research questions, approved methods, formatting requirements, codebook, and relevant output or syntax. Highlight supervisor comments and identify your deadline. Visit our statistical consulting services and pricing page, or request a scoped Chapter 4 review. A clear brief helps distinguish an editorial task from work that requires reanalysis.