

Regression analysis help is useful when your research question concerns relationships, adjusted comparisons, or prediction. The difficult part is rarely pressing Run in SPSS. It is deciding what to model, how to represent the variables, and which conclusions the design can support. An impressive model summary cannot compensate for an unsuitable outcome model or poorly defined research question.
This guide explains a practical regression workflow for a dissertation or student research project. It focuses on linear regression, then distinguishes logistic, count, survival, and multilevel models. You will find an invented coefficient example, diagnostic questions, reporting advice, and a consultation checklist. The discussion primarily addresses students at US universities and also applies to UK master’s and doctoral research.
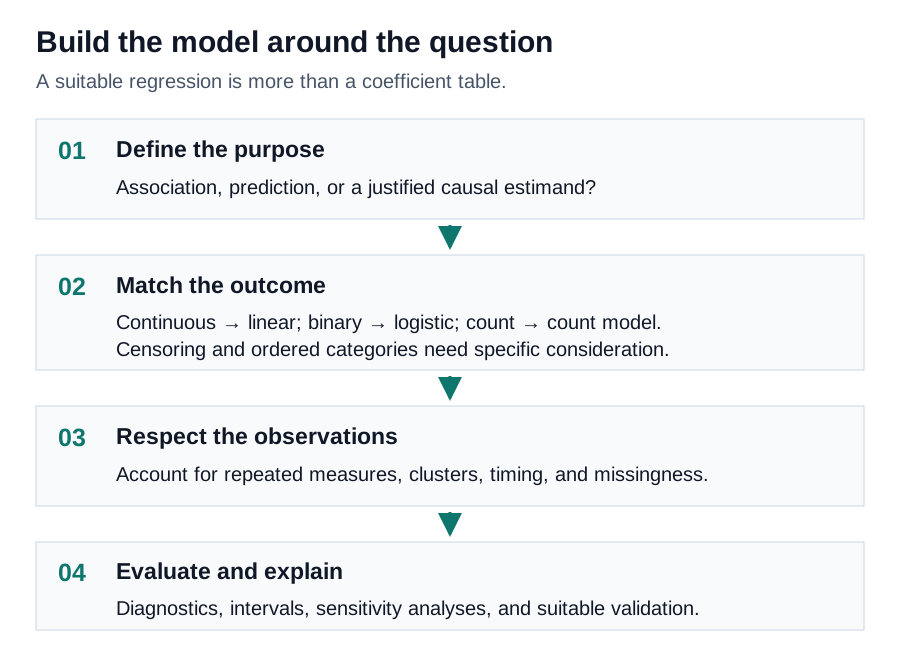
Start with the question regression should answer
Write down the outcome, predictors, target population, and purpose of the model. For example: among first-year students, how is weekly study time associated with final examination score after accounting for baseline attainment? This is an adjusted association question. It differs from predicting the score of a future student and from estimating the causal effect of an intervention that increases study time.
These purposes require different decisions. Explanatory work needs a defensible account of why variables enter the model. Prediction needs a realistic assessment on data not used to fit or tune it. Causal interpretation needs assumptions about treatment assignment, confounding, timing, and selection that regression alone cannot establish.
For general project planning, read SPSS dissertation help. If the key question compares categories, our ANOVA analysis guide explains the corresponding group-comparison perspective. Both approaches can belong to the same general linear-model framework.
Choose a model that fits the outcome
Continuous, binary, and ordered outcomes
Linear regression models the conditional mean of a numerical outcome. A binary outcome, such as completion versus noncompletion, usually calls for a model designed for probabilities, often logistic regression. An ordinal outcome has ordered categories whose distances may not be equal. Treating such categories as an ordinary score requires a justification, not simply numeric coding.
Multinomial logistic regression concerns unordered categories. Its reference category determines how coefficients are expressed. Ordinal models make additional structural assumptions, such as proportional odds in a common specification. Check these assumptions and consider alternatives when the outcome structure or evidence does not support them.
Counts, event times, and clustered observations
Count outcomes may suggest Poisson or negative binomial models, with attention to exposure periods and dispersion. Time-to-event analysis must account for censoring; a participant who has not experienced the event is not necessarily an ordinary missing value. Cox regression introduces its own assumptions, including proportional hazards.
Students within schools, patients within hospitals, and repeated observations within people create dependence. A mixed-effects or appropriately cluster-aware approach may be needed. The correct model follows the observation structure. It should not be chosen because a familiar software dialog accepts the dataset.
Prepare variables before fitting a regression
Preserve an unchanged source file and work from a documented copy. Check units, ranges, missing-value codes, duplicate identifiers, and recruitment eligibility. A study-hours variable recorded in minutes for some participants and hours for others creates a false pattern that no regression option can repair. Resolve these inconsistencies with the codebook or collection records.
Explain how questionnaire scores were constructed. Reversed items, partial completion, and minimum response rules should follow the instrument’s instructions and your protocol. A sum or average is not automatically a valid measurement of a construct. Our SPSS questionnaire analysis help guide covers those earlier decisions.
Report missingness by variable and describe the analysis sample. Complete-case analysis can reduce precision and introduce selection problems under some missingness mechanisms. Multiple imputation may be appropriate, but it requires a suitable model and correct pooling. Do not replace missing values with the sample mean merely to keep the original row count.
Code categorical predictors explicitly
A nominal predictor with three categories cannot usually be represented by a single numeric term coded 1, 2, and 3. That specification imposes an ordered, equally spaced trend. Instead, define the required indicator variables or another justified contrast system. State the reference category so readers can interpret each comparison.
For example, with classroom, online, and blended delivery, two indicators can compare online and blended delivery with classroom delivery. The intercept then refers to the reference group when the continuous predictors equal zero. If zero is outside the observed or meaningful range, centering a predictor can make the intercept easier to interpret without changing the basic fitted relationships.
Keep a coding table beside the analysis syntax. Check that categories have enough observations and outcome variation for the selected model. Sparse cells and rare events can destabilize estimates, particularly in logistic models. A converged procedure does not guarantee reliable coefficients.
Select covariates from the design, not a p-value contest
Covariate selection should follow the research question, prior evidence, and timing of measurement. A potential confounder is not defined solely by statistical significance in your sample. Conversely, a variable associated with the outcome is not automatically appropriate to adjust for. Variables affected by the exposure can change the target effect or introduce bias.
Write a short rationale for each proposed predictor before examining the final coefficients. Distinguish mandatory design variables from exploratory candidates. Consider a causal diagram when the project seeks an effect rather than prediction. Document alternative specifications as sensitivity analyses instead of presenting every trial as the original plan.
Stepwise procedures can produce unstable selections and optimistic results when treated as a substitute for design. If a course requires stepwise regression, explain its role and limitations. Do not describe the retained variables as the only factors that matter in the population.
Build a transparent SPSS linear regression workflow
In many SPSS versions, linear regression appears under Analyze, Regression, and Linear. Menu wording and available options can differ by version and license. Set the numerical outcome as the dependent variable and enter the planned predictor terms. Request coefficient intervals and the diagnostics your analysis needs. Paste the commands into a syntax file before running them.
IBM’s linear regression statistics documentation describes coefficient estimates, confidence intervals, model-fit summaries, and collinearity diagnostics. Use it to confirm the software options, then explain why those options are relevant to your own model.
Check the retained sample size, active filters, weights, and split-file settings. Save residuals, fitted values, and influence measures when needed. Name model versions clearly, such as planned model and sensitivity model. Avoid relying on a sequence of unlabeled output windows whose settings cannot later be reconstructed.
Evaluate assumptions using the fitted model
Linearity concerns the modeled conditional relationship, not whether every raw variable has a bell-shaped histogram. Plot residuals against fitted values and relevant predictors. Curvature can suggest an omitted nonlinear term or a mismatch between the mean structure and the data. Consider a transformation, polynomial term, or another model only when its meaning and purpose are clear.
Constant error variance concerns the spread of errors across fitted values or predictor settings. A fan-shaped residual plot may indicate heteroscedasticity. Appropriate robust standard errors can address some inferential problems, but they do not repair an incorrect mean model, severe dependence, or an unsuitable outcome distribution.
Normal-error assumptions matter for conventional small-sample inference in linear regression. They do not require every predictor to be normally distributed. Examine the residual distribution and unusual observations while keeping the design and sample size in view. The NIST model-validation guide emphasizes residual assessment rather than treating a high R squared as sufficient validation.

Distinguish outliers, leverage, and influence
An outlier has an unusual outcome relative to the fitted model. A high-leverage observation has unusual predictor values. An influential observation substantially affects the fit or selected estimates. These concepts overlap, but they are not identical. A case with an extreme predictor can follow the fitted relationship closely and still deserve attention.
Investigate flagged cases for data-entry errors, unusual study conditions, or valid but uncommon observations. Correct demonstrable errors using an auditable record. Do not remove a valid participant because doing so improves significance. If an influential case materially changes an important conclusion, report a sensitivity analysis and explain both fits.
Use numerical thresholds as screening aids, not automatic deletion rules. The appropriate response depends on the number of predictors, sample size, design, and purpose. Keep identifiers separate from public reporting so that diagnostic review does not disclose participant identities.
Multicollinearity and the meaning of adjustment
Highly overlapping predictors can make their individual coefficients imprecise and sensitive to small changes. Examine the underlying constructs, correlation structure, and relevant diagnostics. A variance inflation factor describes one aspect of coefficient uncertainty; it is not a universal pass-or-fail test with a threshold suitable for every model.
Suppose two questionnaires both measure academic confidence. Including both may ask about the association of one score while holding the other fixed. That comparison might be scientifically useful, but it can also have a narrow interpretation and limited independent information. Explain what holding the other variable constant means in the study.
Centering predictors can improve the interpretation of models with interactions or polynomial terms. It does not remove the fundamental overlap between two substantively redundant measures. Combining variables, changing the model, or retaining both should follow the research purpose and measurement evidence rather than a cosmetic attempt to lower a diagnostic.
An invented coefficient example
Consider an invented linear model for 120 students. The outcome is examination score, the main predictor is weekly study hours, and baseline attainment is a covariate. Suppose the fitted equation is score = 20 + 2.4 times study hours + 0.6 times baseline attainment. These numbers illustrate interpretation only; they do not describe a real student dataset or service outcome.
The study-hours coefficient means that a one-hour difference is associated with an estimated 2.4-point difference in mean score among students with the same baseline attainment in this model. It does not mean every additional hour raises an individual’s score by exactly 2.4 points. Nor does adjustment for one measured covariate eliminate all confounding.
If the coefficient’s standard error is 0.8, a conventional 95% interval using approximately 1.98 as the critical value is 0.82 to 3.98 points. The interval conveys uncertainty about the population coefficient under the model. It is not an interval containing 95% of individual students’ score changes.
For five study hours and baseline attainment of 60, the fitted mean is 20 + 12 + 36 = 68. A prediction interval for a new individual’s score would additionally account for individual outcome variation. It is normally wider than a confidence interval for the corresponding mean.

Interpret R squared without making it a quality score
Suppose the invented model has R squared = .38. Within this sample, the fitted model accounts for 38% of the outcome’s variation around its mean. With two predictors and 120 observations, adjusted R squared is approximately .369. The adjusted value reflects a penalty for predictor count, but it does not establish external predictive performance.
A high R squared can coexist with biased predictions, inappropriate functional form, influential cases, or data leakage. A lower value can still accompany a useful and precisely estimated association in a naturally variable outcome. Judge the model against its purpose and compare its errors with a meaningful baseline.
For prediction, assess performance using a justified validation strategy. Keep preprocessing and model selection inside the training process to avoid leaking information from validation observations. Report an error measure in the outcome’s units where possible, and distinguish in-sample fit from performance on genuinely new data.
Interactions and hierarchical regression
An interaction asks whether one predictor’s association with the outcome depends on another variable. For example, the study-hours association might differ by delivery mode. Include the relevant lower-order terms and define the reference values carefully. The coefficient for study hours then describes its association at the moderator’s reference value, not necessarily an overall average effect.
Show predicted values or conditional associations at meaningful, observed moderator values. Do not extrapolate to implausible combinations merely because they make a dramatic plot. When comparing subgroup associations, test the interaction or relevant contrast directly rather than comparing separate significance labels.
Hierarchical regression enters theory-defined blocks in a planned order. An R-squared change addresses the additional fit from a block given earlier blocks. It does not establish a causal hierarchy. If the proposed mechanism involves an intermediate variable, our mediation analysis help guide explains the extra design and interpretation requirements.
Logistic regression needs different language
A logistic coefficient is expressed on the log-odds scale. Exponentiating it gives an odds ratio for the defined comparison, conditional on the other modeled predictors. An odds ratio is not generally a risk ratio. The difference becomes especially important when the outcome is common, because describing odds as probability can substantially mislead readers.
Specify which outcome category is modeled and how reference categories are coded. Interpret intervals for odds ratios on the same scale. Consider model calibration and discrimination when prediction matters, and investigate sparse data or separation when estimates become extreme. A large coefficient with an enormous interval may indicate little useful information rather than a powerful finding.
Use IBM’s regression command reference as a software reference, not as permission to use linear-regression assumptions for every procedure. Each outcome model needs its own checks.
Report estimates, uncertainty, and analytical decisions
A readable results section identifies the sample, outcome scale, predictors, coding, missing-data approach, and model specification. Present relevant coefficients with standard errors or confidence intervals, suitable fit information, and diagnostic findings. Keep the number of displayed decimals consistent and meaningful. A table should allow readers to identify the comparison behind every estimate.
APA’s quantitative reporting standards support transparent reporting. Distinguish planned regression analyses from exploratory changes.
The ASA statement on p-values cautions against threshold-only conclusions. Consider the estimate, uncertainty and design before interpreting your regression.
Check the model against the intended use
Before finalizing a result, ask whether every predictor would be available at the point the model is meant to operate. A university cannot use end-of-semester attendance to predict a student’s risk at enrollment. Including that information may improve retrospective fit while making the proposed application impossible. The same timing problem applies to outcome-derived categories and scores calculated after the event being predicted.
Also check the population represented by your data. A model developed from volunteers in one program may not transfer to another university or discipline. Describe the recruitment frame, important exclusions, and conditions under which extrapolation would be uncertain. External validity is a research question, not a feature that SPSS can switch on.
What to send for regression analysis help
Send your anonymized dataset, codebook, research questions, hypotheses, approved methods, and any scoring instructions. Include existing syntax and output if you have started. Describe recruitment, repeated measurements, clusters, exclusions, weights, and missing values. If the goal is prediction, explain who or what will receive future predictions and under which conditions.
Share your supervisor’s specific concerns, software version, deadline, and permitted scope of external support. We can help with model planning, diagnostic review, reproducible syntax, and interpretation. You remain responsible for understanding the analysis, following academic-integrity rules, and declaring permitted assistance. Do not send direct identifiers or sensitive data that you are not authorized to share.
Review statistical analysis pricing or submit your regression consultation brief. A clear scope is more useful than requesting every possible regression model without a defined research question.
Frequently asked questions about regression analysis
How many predictors can my dissertation include?
There is no single ratio that guarantees an adequate model. Consider sample size, outcome variability, rare categories or events, parameter count, expected effect sizes, and validation needs. Interactions and nonlinear terms consume information too. Plan precision or power for the actual question rather than relying on a generic observations-per-variable rule.
Must my predictors be normally distributed?
No. Conventional linear-regression normality assumptions concern errors for inference, not a requirement that every predictor is normal. A skewed predictor may still need attention because of leverage, functional form, or interpretation. Examine how the fitted model behaves instead of transforming each variable automatically.
Can an existing SPSS model be reviewed?
Yes. Provide the data, commands, output, and written interpretation together. A review can check coding, model suitability, diagnostics, and consistency between estimates and conclusions. Screenshots alone often hide crucial settings. The aim is a defensible analysis you can explain, not a guarantee of significant findings or a particular academic grade.