

SPSS assignment help is most useful when it helps you learn the next step, rather than handing you an answer you cannot explain. You may understand the statistical idea but struggle to import a file, identify the correct output or translate a table into clear English. Those problems need different kinds of support. Start by identifying your specific difficulty and checking what assistance your course permits.
This guide is for students taking statistics and research-methods courses, primarily in the United States and also in the United Kingdom. It explains a practical learning workflow, common software problems and ways to evaluate tutoring. The practice example uses invented observations, not an actual assessed assignment. Your instructor’s rules always determine what outside support is allowed for your work.
Separate tutoring from someone completing your assessment
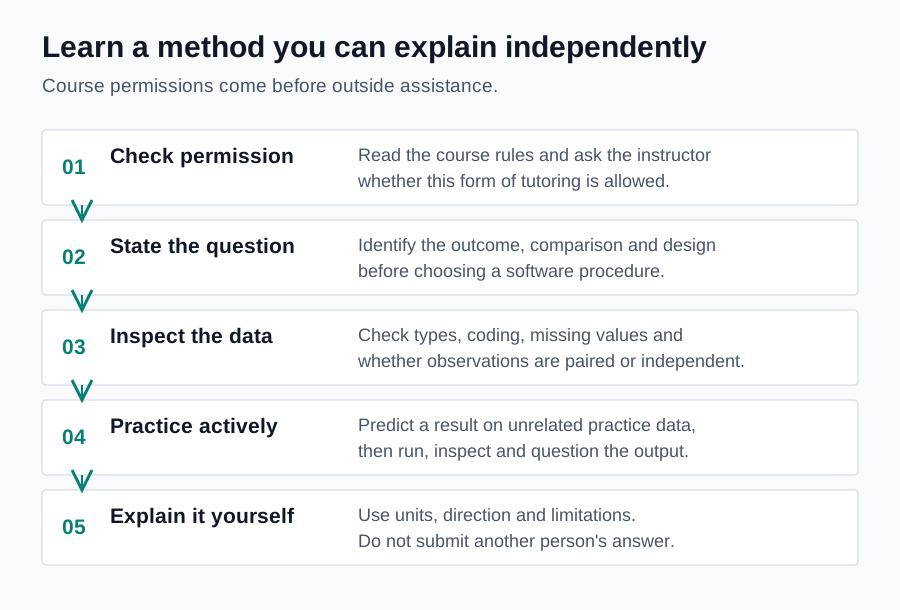
Permission to use SPSS does not mean permission to outsource an assessed analysis. A course may allow discussion of concepts while prohibiting another person from reviewing your code or producing an answer. Other courses permit a wider range of support when it is acknowledged. Read the syllabus, assignment instructions and academic-integrity guidance before sharing the task.
The Stanford Honor Code, for example, distinguishes permitted from unpermitted aid and emphasizes seeking clarification from instructors. It is an institutional example, not a policy that governs every student. Ask your own instructor about tutoring, collaboration, answer checking and AI tools when the boundary is unclear.
A legitimate learning request might ask for an explanation of why repeated measurements require pairing, using an unrelated practice dataset. A different request asks someone to complete a graded take-home test. Those are not equivalent. Tell a tutor about the assessment restrictions before the session starts, and decline assistance that would cross them.
Diagnose the problem before asking for SPSS assignment help
Try to name the stage where you become stuck. Is the issue understanding the question, preparing the data, choosing a method, operating the software or interpreting the result? “SPSS is not working” provides little information. “My group variable appears as text and does not enter the numeric comparison dialog” identifies an issue that can be investigated.
Write down what you expected, what actually happened and what you have already tried. Include the software version, the exact error message and a small permitted example when possible. Do not upload a complete class dataset to a public forum if your instructor or the data provider restricts sharing.
Bring an attempted explanation as well as a technical question. For instance, state that you think the observations are paired because each person appears twice. A tutor can then check the reasoning rather than only show you where to click. Understanding the reason makes it easier to transfer the method to a differently worded problem.
Translate a question into an analysis plan
First identify the outcome. Then decide whether the question concerns a summary, a comparison or a relationship. List the units and measurement types. A binary completion indicator differs from a score ranging from zero to one hundred. An ordered response from strongly disagree to strongly agree needs more context than its numeric coding alone provides.
Next identify the observational unit and design. Are the observations from independent people, repeated occasions or clusters such as classrooms? Two columns do not automatically represent paired data. They must refer to connected observations, such as measurements on the same participant. Likewise, two groups should not be treated as independent when they consist of matched or repeated units.
Record a provisional method and why it fits. Your course may deliberately limit the methods you are expected to use. If a problem specifies a particular test, understand its purpose and assumptions rather than replacing it with a more advanced technique. If the design appears inconsistent with the instruction, ask the instructor instead of silently changing the task.
Read Data View and Variable View with a purpose
Data View lets you inspect recorded observations, but an apparently tidy grid can hide coding problems. Check whether each row has the unit you expect and whether columns contain the intended values. A header imported as the first observation, a comma used unexpectedly as a decimal separator or a blank category can change an analysis without producing an obvious crash.
Variable View describes properties of the columns. Inspect names, types, labels, value labels and missing-value definitions. A variable storing group codes as one and two is not automatically a continuous measurement. Its meaning depends on what those codes represent. Setting a measurement label does not turn inappropriate values into an appropriate research measure.
Use a frequency table for categorical variables and simple summaries for numeric variables before running the main test. Compare the observed range with the question or codebook. If a five-point response item contains a value of fifty, investigate it. Correct a demonstrable recording error only through a documented process; do not guess what the value should have been.
Preserve your work with syntax and clear filenames
Menu actions are easy to forget between study sessions. Syntax provides a record you can reread, annotate and rerun. IBM’s guide to pasting syntax explains how selections in dialogs can generate commands that you can edit and save. Use the documentation for your installed version when details differ.
Keep the starting data separate from your working data. Name files so their purpose is clear, such as practice_input, practice_analysis and practice_output. Avoid final_final_new unless you also have a reliable version record. Save enough context to understand which dataset produced which output.
Annotate your own syntax with the question being addressed and the meaning of important options. Do not copy a long command file and assume it fits because it runs without errors. A successful run only shows that the software accepted the instructions. It does not establish that the instructions answer your question.
An invented paired-measurement practice exercise
Imagine an ungraded practice exercise measuring six learners’ confidence before and after a workshop. The scores below are invented on a scale from zero to twelve. Each row represents the same learner at both occasions. The purpose is to understand the structure of paired data, not to demonstrate that a real workshop works.
| Practice ID | Before | After | Difference |
|---|---|---|---|
| A | 6 | 7 | 1 |
| B | 5 | 7 | 2 |
| C | 7 | 8 | 1 |
| D | 4 | 4 | 0 |
| E | 8 | 11 | 3 |
| F | 6 | 5 | −1 |
The before scores sum to thirty-six, giving a mean of six. The after scores sum to forty-two, giving a mean of seven. The six differences sum to six, so their mean is one. Check these simple calculations yourself before relying on any output. They provide a useful way to detect a reversed subtraction or an incorrect pairing.
Four learners increased, one stayed the same and one decreased. That pattern is more informative than saying that every learner improved. A paired analysis uses the within-person differences; it should not treat the twelve recorded scores as twelve unrelated people. In a real study, the design, scale and difference distribution would guide the choice of an inferential procedure.

Explain what the practice result does and does not show
A careful descriptive sentence would say: “In this invented six-person practice sample, the mean after score exceeded the mean before score by one point.” It identifies the sample, direction and units. It does not claim that the workshop caused the difference or that the result applies to all learners.
The exercise has no comparison condition, no real recruitment process and deliberately invented values. Those limitations matter more than adding a sophisticated test to the table. If you later run a paired test as a learning exercise, keep the analysis explicitly hypothetical and interpret the estimate and uncertainty rather than only searching for a significance label.
The American Statistical Association’s statement on p values distinguishes significance from effect size. Explain the study question rather than treating one output cell as the answer.
Read the right output before writing a conclusion
Start by identifying the procedure and variables shown in the output. Check the number of cases included. If a result uses fewer observations than expected, inspect missing values, selection settings and the requirements of the procedure. A table from an earlier run can look plausible while referring to a different version of your work.
Separate descriptive statistics from inferential statistics. Means and standard deviations describe observed scores. An interval describes uncertainty under a statistical model. A test statistic and p value address a defined null hypothesis under its assumptions. These quantities are related, but they do not all mean the same thing.
Check direction carefully. A mean difference may be first variable minus second variable, not the reverse. A regression coefficient depends on the outcome’s units and the predictor’s coding. A categorical comparison depends on the reference category. Write a short interpretation using actual variable names and units before polishing the prose.
Use a small troubleshooting checklist
If the software rejects a variable, inspect its type and the procedure’s requirements. A column imported as a string may contain spaces, currency symbols or mixed text and numbers. Do not force a conversion without checking what will happen to nonnumeric entries. Preserve the original values until you understand the issue.
If your result differs from a teaching example, check filters, split-file settings, weights and missing values before assuming that SPSS calculated incorrectly. Also check the test option, confidence level and group definition. A difference in one setting can lead to an output that looks similar but answers a different question.
If a chart looks strange, verify the variable and summary statistic used to build it. A chart of counts is not a chart of average scores. Axis scaling can make small differences appear larger, while truncated category labels can make the display difficult to interpret. Match the visualization to the question rather than choosing the most decorative option.

Write a clear statistical explanation in your own words
Use a three-part structure: name the analysis and question, state the relevant result, then explain its meaning and limitation. Include the quantities requested by your instructor. Avoid copying an SPSS table into a paragraph without explaining why it matters. Equally, avoid a confident narrative that leaves out the numerical evidence.
Prefer the language of the problem over generic variable letters. “The average practice score was one point higher after the session” is easier to understand than “Y increased.” When a result is uncertain, explain that uncertainty directly. Do not change “did not establish a difference” into “proved there is no difference.”
APA quantitative reporting resources address research studies. Follow your assignment’s specific format and rounding instructions.
Make tutoring sessions active rather than passive
Choose one or two learning goals for each session. For example, aim to understand pairing and to identify the mean-difference direction in a practice output. Bring your attempted reasoning. A session with a narrow target often produces more usable learning than one that tries to cover an entire statistics course.
Ask the tutor to explain a step, then try a new practice step yourself. Predict the output before running it. If you predict that reversing the two variables will change the sign of a difference, check whether it does. This turns a software demonstration into a reasoning exercise.
Finish by explaining the method without looking at your notes. State what you learned, what remains confusing and what you will practice next. Keep a record of assistance if your course requires acknowledgment. Do not ask a tutor to impersonate you, access your student account or hide the session from an instructor.
Manage a deadline without skipping the learning process
When time is short, separate essential requirements from optional polish. First make sure you understand the question and can open the permitted dataset. Then verify the variables, run the required analysis and explain the principal result. Elaborate charts should not consume the time needed to check a wrong group definition.
If you cannot complete the work within the permitted rules, contact the instructor about available support or extension procedures. A third party cannot grant an academic extension. Avoid anyone promising guaranteed marks, undetectable work or a complete submission in your name.
If you request paid tutoring, inspect the current pricing factors and confirm the scope before ordering. A quotation should identify the learning or review task, not imply that payment guarantees a particular academic outcome. The appropriate support depends on what your course authorizes.
Check your reasoning without an answer key
Several simple checks can reveal an error before you know the expected result. Counts should add up to the number of eligible observations when categories are exhaustive and mutually exclusive. A mean should fall between the smallest and largest included values. If a calculation violates either check, revisit the data and settings before interpreting the table.
Use a tiny invented dataset when you want to understand a procedure. For example, create three clearly labeled practice observations and calculate their average by hand. Then ask SPSS for the same summary. Change one value and predict the direction of the change. This exercise checks your understanding of what the command summarizes, without using anyone’s assessment answer.
Also check whether an apparently reasonable result answers the right question. A frequency table might correctly count a group variable while the question asks for a group’s average score. The software can be correct and the response still be irrelevant. Label every table with the question it helps answer, even if that label is only in your private study notes.
Finally, separate a numerical disagreement from a conceptual disagreement. A rounding difference may not change an interpretation. A different reference group may reverse the sign while preserving the same comparison. A mistaken independence assumption can affect the analysis much more seriously. Learn to ask which kind of difference you are seeing instead of treating every mismatch as equally important.
These checks do not certify that an assessed response is correct. They are study habits that help you notice problems and formulate better questions. If your course prohibits outside review, take the uncertainty to the instructor or use the authorized support channel rather than seeking a hidden answer check.
Build habits that help with the next assignment
Create a personal error log. For each mistake, record the symptom, cause and prevention step. An entry might note that a text-coded group variable was imported incorrectly, followed by the import check that would catch it next time. Review the log before starting a new task.
Maintain a small collection of unrelated practice datasets with clear labels. Use them to rehearse frequency tables, group comparisons and simple relationships. Do not store classmates’ solutions or unauthorized assessment materials as practice resources. A practice archive should help you understand methods, not provide templates to copy into submissions.
As your projects become larger, connect these skills to a research workflow. The hypothesis testing guide explains how questions connect to statistical evidence. The dissertation analysis guide shows how documentation, interpretation and institutional permissions matter beyond a single classroom exercise.
Questions about permitted SPSS coursework support
Can a tutor check my answer?
Only when your instructor permits that form of assistance. Some courses allow conceptual discussion but not answer checking. Ask specifically and share the restrictions with the tutor. When answer checking is prohibited, use an unrelated practice problem instead of showing the assessed answer.
Can I share screenshots of my output?
Check both assessment rules and data restrictions. A screenshot can reveal participant information, restricted teaching material or your assessed response. Remove identifiers where appropriate, and do not post screenshots publicly simply because they look anonymous at first glance.
Why do I understand the clicks but not the interpretation?
Operating the software and reasoning statistically are separate skills. Return to the outcome, design and question. Ask what the reported estimate compares or predicts. Practice translating a number into a sentence with units before adding technical terminology.
What should I send when requesting tutoring?
Send your learning goal, software version, permitted scope and a description of the difficulty. Include only material you are allowed to share. You can inspect the available support areas and use the quotation form to request a scoped tutoring discussion. Availability and suitability must be confirmed before any session.